Precision Forecasting with the Polynomial Regression Extrapolation Indicator for MT4
In the competitive world of Forex trading, the ability to separate temporary price fluctuations from the underlying trend is what distinguishes professional traders from the rest. While traditional linear moving averages provide a basic view of direction, they often fail to capture the natural, curving rhythms of market cycles. The Polynomial Regression Extrapolation Indicator for MetaTrader 4 (MT4) is a sophisticated mathematical tool designed to solve this problem by fitting complex curves to price data, offering a superior method for trend detection and future price projection.
The Science of Curvilinear Trend Analysis
Unlike standard linear regression, which assumes price moves in a straight line, polynomial regression uses higher-degree equations to create a flexible line of best fit. This allows the indicator to "bend" with the market, capturing the acceleration and deceleration of Price Action that linear tools simply miss.
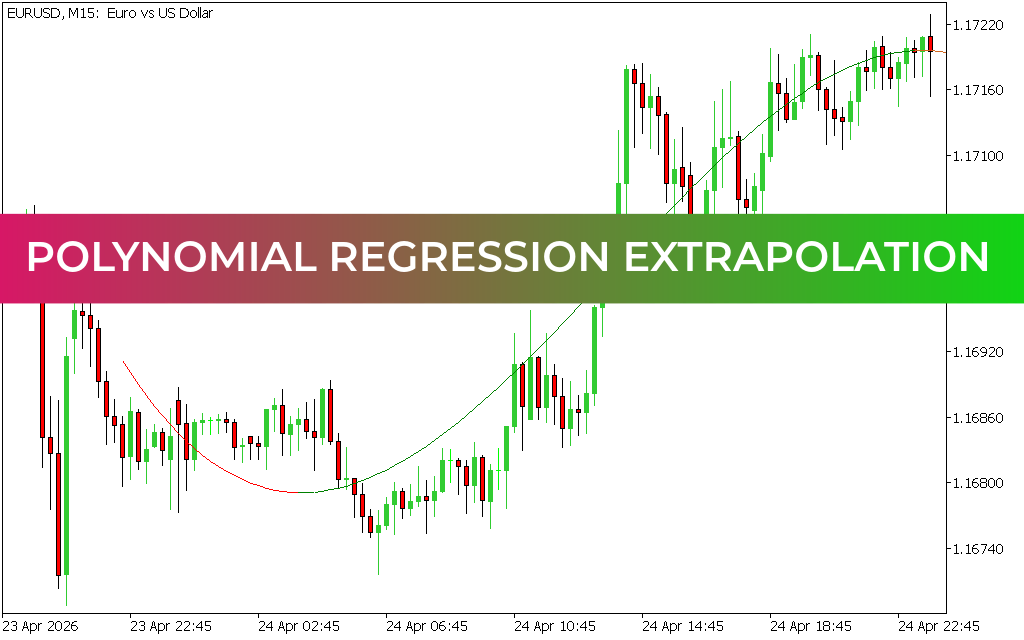
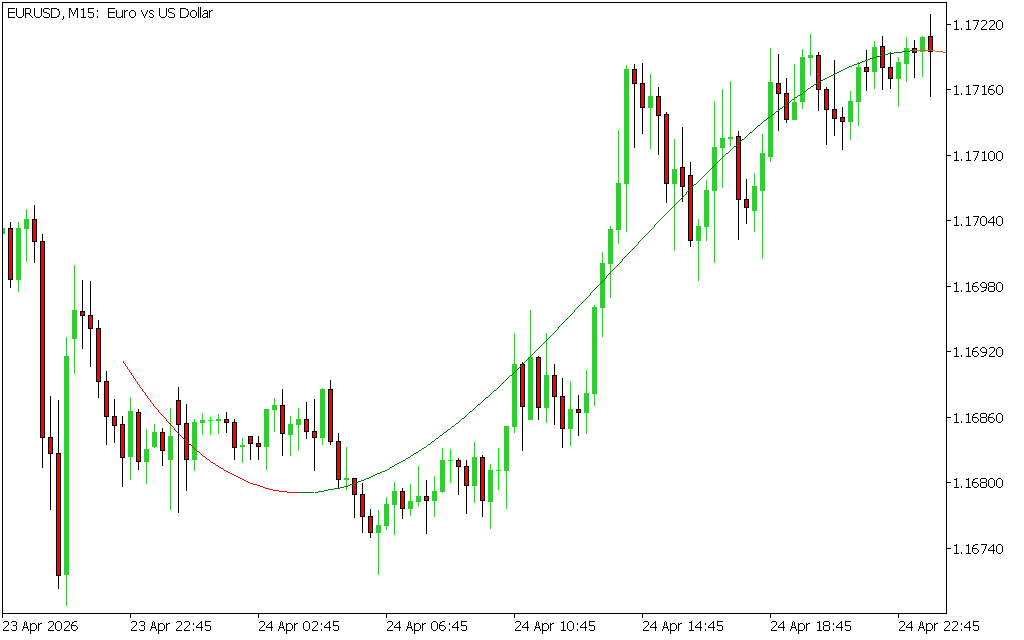
As demonstrated in the recent EURUSD M15 price action from April 24, 2026, the indicator provides a clean, adaptive signal directly on the main chart window:
- The Adaptive Trend Line: The indicator plots a continuous, smoothing curve that changes color based on the slope of the regression. A green line signifies a bullish acceleration phase, while a red line alerts traders to a bearish shift.
- The Extrapolation Effect: The true power of this tool lies in its "extrapolation" feature. By calculating the most likely mathematical path forward, it extends the regression line beyond the current candle, providing a predictive "look-ahead" into potential future price zones.
- Curvature Sensitivity: On the M15 EURUSD chart, the indicator successfully identified the rounding bottom near 1.16800, transitioning from red to green well before a standard moving average would have signaled the recovery toward 1.17200.
Strategic Implementation: Beyond Simple Crossovers
The Polynomial Regression Extrapolation Indicator is a versatile asset that can enhance multiple trading styles:
- Trend Reversal Trading: Look for the specific moment the curve changes color and its slope shifts from negative to positive. This mathematical "pivot" often precedes significant trend changes.
- Dynamic Support And Resistance: In a trending market, the regression curve acts as a moving value area. During the bullish run on EURUSD, the green line provided a clear visual guide for the "mean" price, helping traders avoid buying at overextended peaks.
- Volatility Filtering: When the regression line remains relatively flat or changes color frequently, it signals a non-trending, range-bound market, warning traders to tighten their risk management.
Why Professional MT4 Traders Choose Polynomial Regression
This indicator is engineered for clarity and mathematical rigor. It removes the subjectivity of manual trendline drawing and replaces it with quantitative certainty.
- Non-Repainting Logic: The indicator is optimized for the 2026 trading environment, ensuring that historical signals remain consistent for accurate backtesting.
- Multi-Timeframe Versatility: Whether you are Scalping the M1 timeframe for quick intraday gains or analyzing the Daily chart for long-term swings, the polynomial algorithm adapts to the specific data density of your chart.
- Low Lag, High Smoothing: Experience the benefits of a heavily smoothed trend line without the devastating lag associated with traditional moving averages.
Stop following the market in straight lines when the market moves in cycles. By integrating the Polynomial Regression Extrapolation Indicator into your MT4 terminal, you gain a predictive edge that aligns your strategy with the mathematical reality of price action.
6 Downloads
Last Update:
Apr 25, 2026 16:14 PM
Published:
Feb 02, 2026 19:52 PM
Category: