The Kijun Sen Indicator for MT4 is a refined version of the popular Ichimoku Kinko Hyo system, displaying only the Kijun-Sen line on the chart. This allows traders to focus purely on price and trend structure without the clutter of the full Ichimoku setup.
Also known as the “Base Line,” the Kijun-Sen is one of the most reliable tools in technical analysis for identifying trend direction, momentum, and potential reversal points. The indicator works well on all timeframes — from Scalping on M1 to swing trading on D1 — and offers a minimalist yet powerful way to trade using Ichimoku logic.
How the Kijun Sen Indicator Works
The Kijun Sen line represents the average of the highest high and the lowest low over a defined period, typically 26 candles. It acts as both a trend signal and a dynamic support/resistance level.
Formula:
(Highest High + Lowest Low) / 2 over the last 26 periods
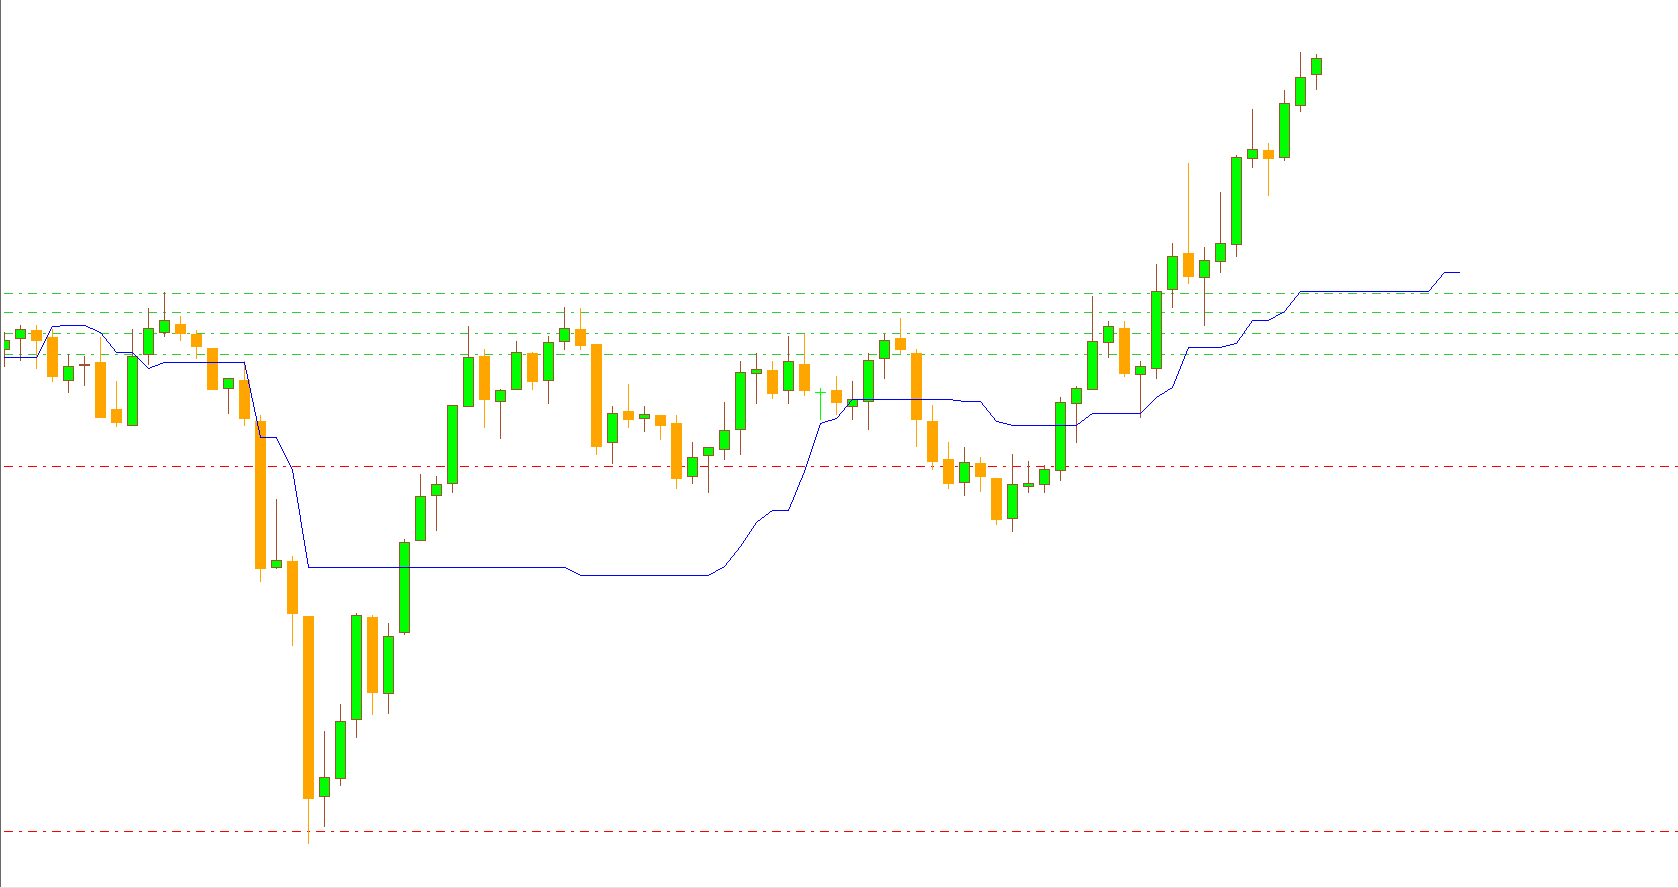
On your MT4 chart, the indicator plots a blue line that tracks the market’s medium-term equilibrium.
When price is above the Kijun-Sen, the market is bullish.
When price is below, the trend is bearish.
This clean, single-line approach makes it ideal for traders who want to focus on pure trend dynamics without unnecessary indicators cluttering their charts.
Kijun Sen Indicator for MT4 Trading Signals
The Kijun Sen Indicator generates signals based on price crossovers and trend interactions with the line. Let’s break down the primary trade setups:
Buy Signal (Bullish Crossover)
When the price crosses above the Kijun-Sen, it signals the beginning of a bullish trend. Traders can:
Enter buy positions at the close of the candle that breaks above the line.
Place a stop-loss below the most recent swing low.
Exit the trade when the price closes below the Kijun-Sen.
Sell Signal (Bearish Crossover)
When the price drops below the Kijun-Sen, it suggests a bearish reversal. Traders should:
Enter sell positions when the candle closes below the Kijun-Sen.
Set a stop-loss above the previous swing high.
Exit or take profit once price crosses back above the line.
Dynamic Support and Resistance
The Kijun-Sen acts as a floating support or resistance level.
In an uptrend, price often bounces off the Kijun-Sen — a good opportunity to re-enter long trades.
In a downtrend, it acts as resistance, ideal for short re-entries.
Benefits of Using the Kijun Sen Indicator
Clean, Focused Ichimoku Trading
By removing all other Ichimoku components, this indicator helps you focus solely on Trend Strength and reversal signals using one clear visual cue.
Reliable Trend Confirmation
The Kijun-Sen reacts slower than short-term averages, filtering out noise and confirming true market direction.
Works on All Timeframes
Scalpers and swing traders alike can use it effectively. On lower timeframes, it reacts quickly to short bursts, while on higher timeframes, it captures major trend shifts.
Ideal for Confluence Trading
Combine the Kijun-Sen with other tools such as:
RSI or Stochastic Oscillator (for overbought/oversold confirmation)
Ichimoku Tenkan-Sen (for a complete Ichimoku setup)
T3 Moving Volume Average (for momentum confirmation)
Perfect for Automation
Because the Kijun-Sen crossover logic is straightforward, it’s easy to integrate into Expert Advisors (EAs) or automated trading systems.
How to Use the Kijun Sen Indicator in MT4
Download and Install: Get the indicator free from IndicatorForest.com.
Load on MT4: Copy the file into your MQL4 > Indicators folder and restart your MetaTrader 4.
Apply to Chart: Choose your preferred currency pair and timeframe.
Trade Setup: Watch for price crossovers or reactions to the Kijun-Sen line.
Confirm Signals: Use trendlines or other tools for additional validation before entering trades.
Conclusion
The Kijun Sen Indicator for MT4 simplifies Ichimoku trading by focusing only on the most critical component — the Kijun-Sen line. It helps traders identify trend direction, reversals, and key support/resistance levels without the visual clutter of the full Ichimoku system.
Whether you’re a scalper, swing trader, or long-term investor, this indicator can help you stay aligned with the trend and improve trade timing.
Download the Kijun Sen Indicator for MT4 now at IndicatorForest.com and start mastering Ichimoku-based trading with clarity and confidence.
FAQ
The Kijun Sen Indicator is a refined version of the Ichimoku system, displaying only the Kijun-Sen (Base Line) on the chart. It represents the average of the highest high and lowest low over 26 periods, acting as both a trend signal and dynamic support/resistance level.
When price crosses above the Kijun-Sen, it signals the beginning of a bullish trend and potential buy opportunities. When price drops below the Kijun-Sen, it suggests a bearish reversal and potential sell opportunities. The line also acts as floating support in uptrends and resistance in downtrends.
The Kijun-Sen reacts slower than short-term averages, filtering out noise and confirming true market direction. It provides clean, focused Ichimoku trading by focusing solely on trend strength and reversal signals using one clear visual cue, making it ideal for traders who want simplicity.
Enter buy positions when price crosses above the Kijun-Sen and closes above it, placing stop-loss below the most recent swing low. Enter sell positions when price closes below the Kijun-Sen, setting stop-loss above the previous swing high. In trends, use pullbacks to the line as re-entry opportunities.
Yes, the indicator works on all timeframes from scalping on M1 to swing trading on D1. On lower timeframes, it reacts quickly to short bursts, while on higher timeframes, it captures major trend shifts. It's also easy to integrate into Expert Advisors for automated trading.
Published:
Nov 05, 2025 12:34 PM
Category: