Optimize Your Trading Strategy with the CCI EMA Indicator
In the world of technical analysis, precision and timing are everything. While the standard Commodity Channel Index (CCI) is a world-class tool for identifying overbought and oversold conditions, it can often produce "jagged" signals that lead to premature entries or exits. The CCI EMA Indicator for MT4 is a sophisticated upgrade that applies an Exponential Moving Average (EMA) to the CCI data, smoothing out market noise and providing traders with a much clearer picture of cyclical trends.
What is the CCI EMA Indicator?
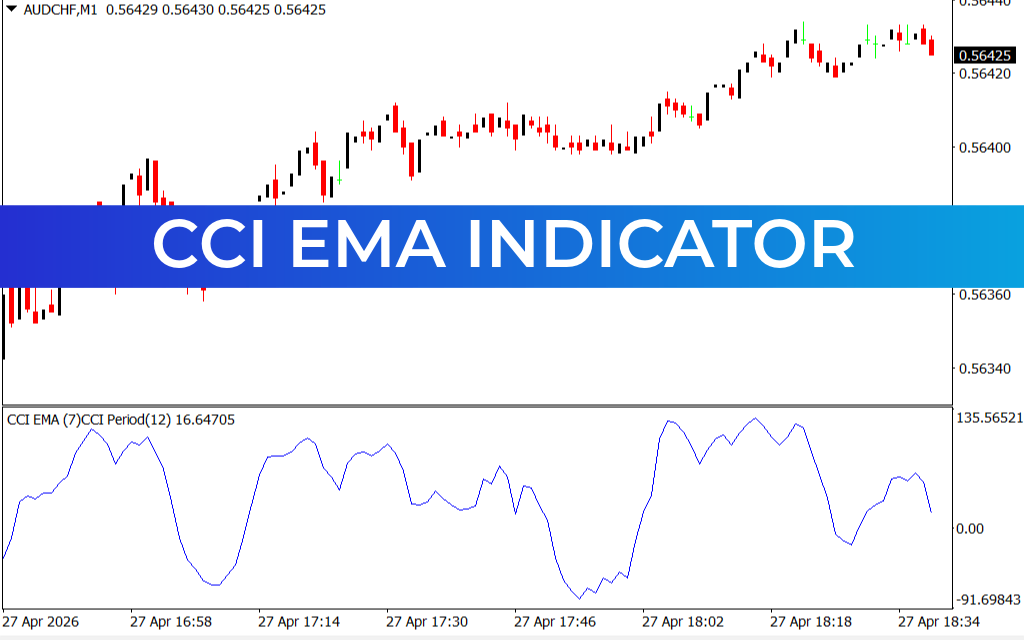
The CCI EMA indicator measures the current price level relative to an average price level over a given period, but with a crucial twist. By integrating an EMA—typically set to a period of 7 as seen in the AUD/CHF M1 chart—the indicator filters out the minor volatility spikes that often plague shorter timeframes. This result is a fluid, oscillating line that tracks price momentum with high accuracy.
The indicator moves around a zero line:
- Above 100: Indicates a strong bullish trend and potential overbought conditions.
- Below -100: Indicates a strong bearish trend and potential oversold conditions.
- The Zero Line: Acts as the equilibrium point where momentum shifts from one side to the other.
Why Smooth the CCI with an EMA?
The primary challenge with the classic CCI is its volatility. In a fast-moving market, the standard CCI line can bounce aggressively, triggering false signals. The CCI EMA version solves this by:
- Trend Smoothing: The EMA component ensures the line moves more predictably, making it easier to identify the actual direction of momentum.
- Cleaner Divergences: Finding divergences (where price makes a new high but the indicator does not) is significantly easier when the indicator line is smoothed, as it highlights the true peaks and troughs of market strength.
- Improved Scalping: On the 1-minute chart provided, the CCI EMA (7, 12) helps scalpers stay in a trend until the momentum truly rolls over, preventing "shake-outs" during minor pullbacks.
Trading Strategies with CCI EMA
One of the most effective ways to use this tool is the Trend Cross Strategy. When the CCI EMA crosses above the zero line, it confirms that momentum has turned positive. If it crosses above the +100 level, it signals an aggressive breakout phase. Conversely, a cross below the zero line indicates that sellers are taking control.
For conservative traders, the best entries occur when the indicator exits extreme zones. For example, if the CCI EMA dips below -100 and then crosses back above it, it provides a powerful "Buy" signal, suggesting the oversold period has ended and buyers are returning to the market.
Conclusion
The CCI EMA Indicator is an indispensable tool for any trader looking to combine the power of momentum oscillators with the stability of trend-following filters. Whether you are a day trader focusing on the M1 timeframe or a swing trader looking for reliable entry points, this indicator provides the clarity needed to navigate complex markets with confidence.
1 Download
Last Update:
Apr 27, 2026 21:40 PM
Published:
Feb 01, 2026 13:01 PM
Category: