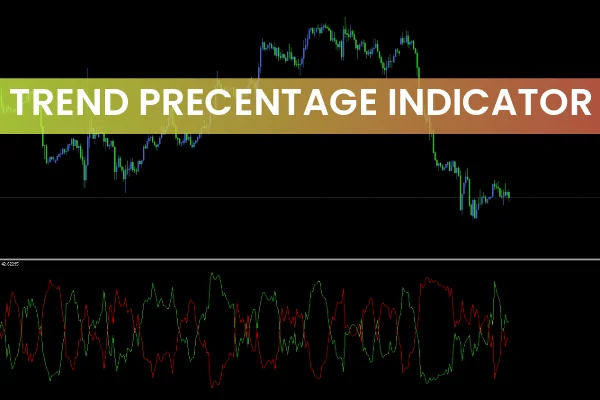
The Trend Percentage Indicator for MetaTrader is an oscillator-based technical tool that measures and displays the percentage difference between bullish and bearish market trends. By analyzing the strength of each side, the indicator helps traders understand the market’s directional momentum — whether buyers (bulls) or sellers (bears) dominate the session.
Unlike traditional BUY/SELL signal indicators, the Trend Percentage Indicator focuses on Trend Strength visualization rather than trade entry triggers. This unique feature makes it an ideal companion to other trading tools, allowing users to confirm market bias before making decisions.
This powerful indicator can be downloaded for free from IndicatorForest.com, your trusted source for accurate and reliable MetaTrader indicators.
How the Trend Percentage Indicator Works
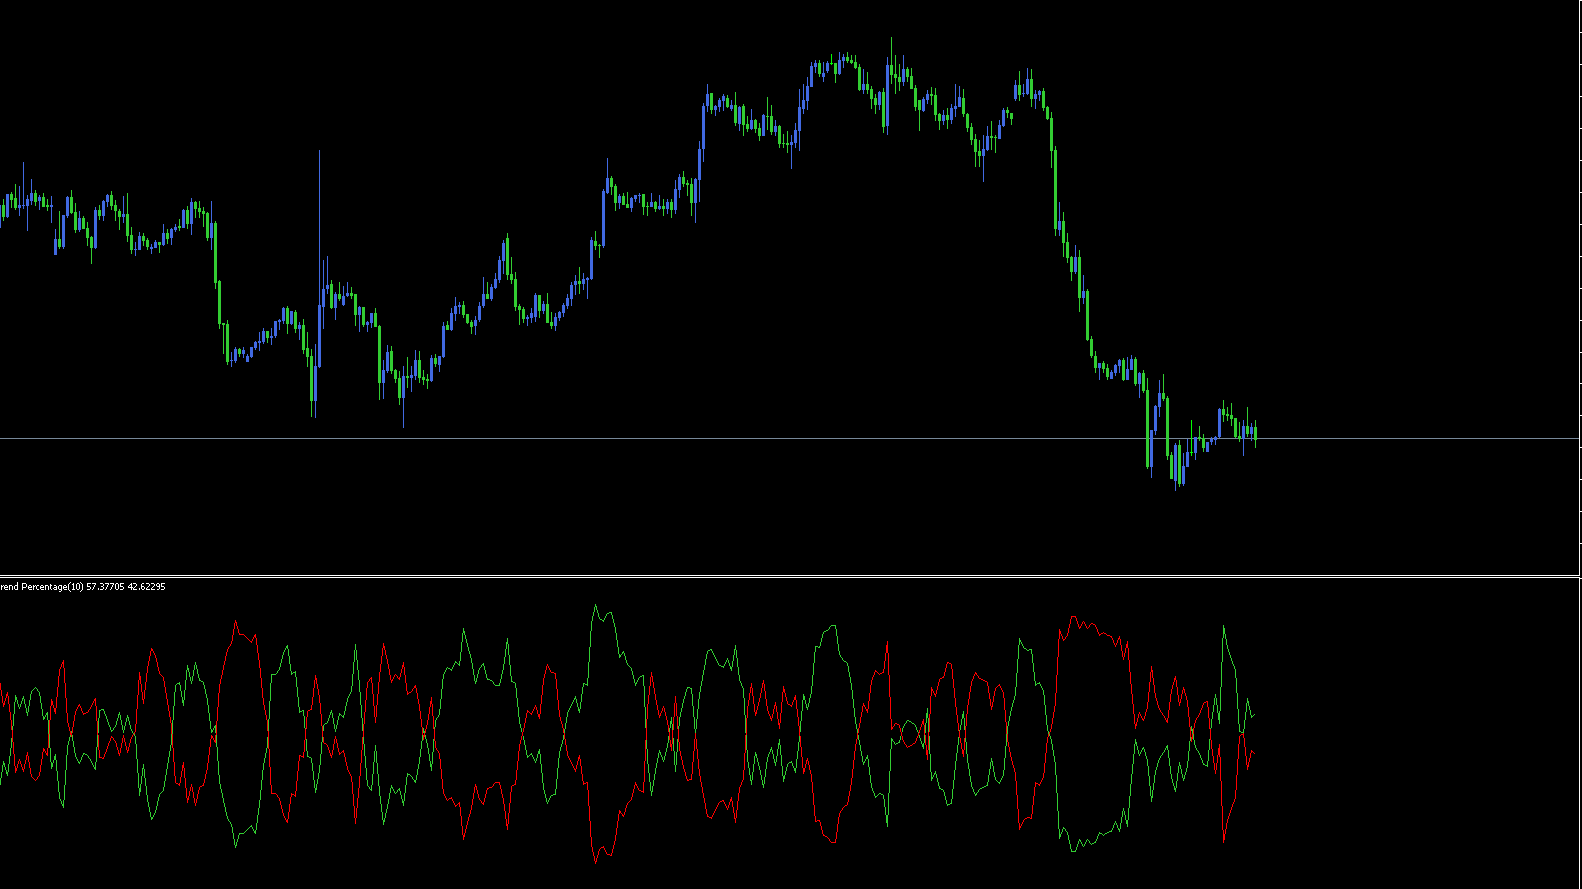
The Trend Percentage Indicator for MT5 operates in a separate oscillator window beneath your main price chart. It uses two dynamic lines—typically green and red—to represent bullish and bearish market movements respectively. The indicator’s algorithm calculates the percentage difference between the two to provide a clear visual of market sentiment.
Green Line: Represents bullish strength or buying pressure.
Red Line: Represents bearish strength or selling pressure.
When the green line is above the red line, it signals that bullish traders are in control. Conversely, when the red line moves above the green, it reflects a stronger bearish sentiment.
This visual clarity allows traders to quickly identify dominant trends, spot potential reversals, and confirm setups before entering or exiting trades.
How To Trade With the Trend Percentage Indicator
The Trend Percentage Indicator for MetaTrader 5 (MT5) is a flexible tool suitable for Scalping, day trading, and swing trading strategies.
To make the most of it:
Combine it with other indicators such as moving averages, RSI, or MACD to confirm trend strength.
Look for crossovers between the green and red lines—these can indicate potential shifts in market sentiment.
Use the percentage difference as a confidence measure: a wide gap suggests a strong trend, while a narrow gap indicates consolidation or indecision.
For example, if the green line remains consistently above the red with a wide margin, you might look for BUY setups supported by bullish Price Action. If the opposite occurs, it may be a good time to consider SELL setups or prepare for retracement opportunities.
Why Use the Trend Percentage Indicator
Here are a few reasons why traders prefer this indicator:
Visual clarity: Easy-to-read lines make trend analysis effortless.
Compatible with all timeframes: From 1-minute scalps to daily or weekly analysis.
No lagging signals: Focuses purely on market strength, not delayed trade alerts.
Free to download: Available exclusively at IndicatorForest.com.
Whether you’re a beginner learning Market Structure or an advanced trader refining entries, this tool enhances your ability to measure momentum objectively.
Tips for Best Results
Use it alongside trend-following indicators for confirmation.
Avoid relying solely on percentage readings; always verify with price action.
Backtest your strategy using historical data before applying it to live trades.
For even more powerful tools, check out the RSI Divergence Indicator on IndicatorForest.com to complement your trading strategy.
Conclusion
The Trend Percentage Indicator for MetaTrader is an essential addition to any trader’s toolkit. It provides valuable insights into bullish and bearish strength, enabling more informed trading decisions.
Whether you trade Forex, indices, or commodities, this indicator helps you visualize the balance of power in the market. Best of all, it’s completely free to download from IndicatorForest.com.
👉 Enhance your trading accuracy today — visit IndicatorForest.com and get your free Trend Percentage Indicator for MetaTrader now!
Published:
Nov 02, 2025 13:45 PM
Category: