Mastering Daily Momentum with the i-Day Bulls Indicator
In the high-velocity environment of Forex day trading, understanding the internal strength of a trend is the difference between catching a massive wave and getting caught in a reversal. While standard trend lines tell you where the price has been, they often fail to quantify the current "buying pressure" within a specific session. The i-Day Bulls Indicator for MT4 is a specialized momentum oscillator designed to isolate and visualize the strength of the bulls, providing a mathematical foundation for intraday trading decisions.
What is the i-Day Bulls Indicator?
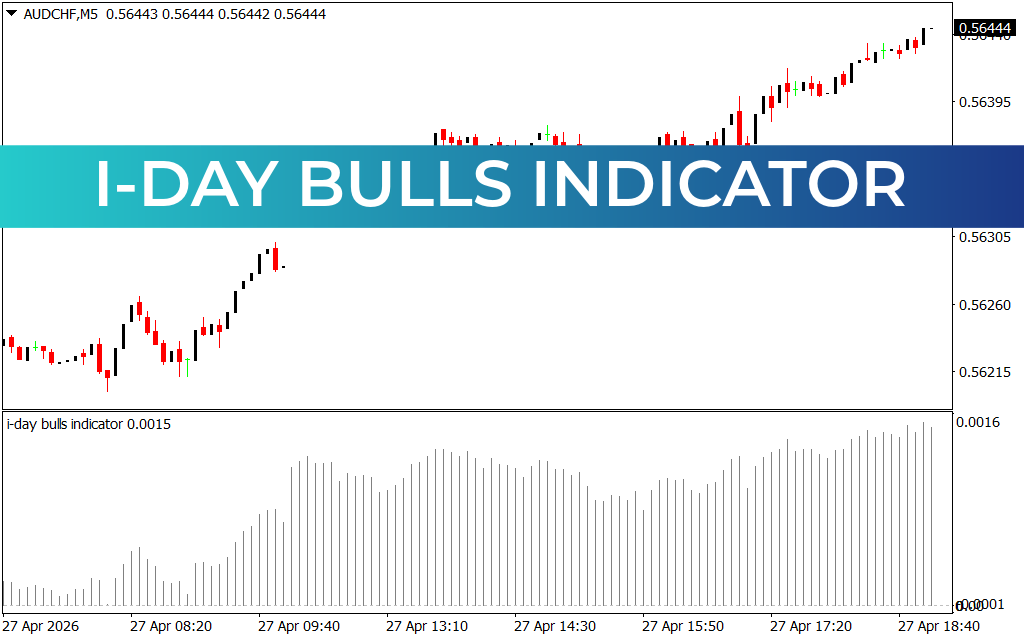
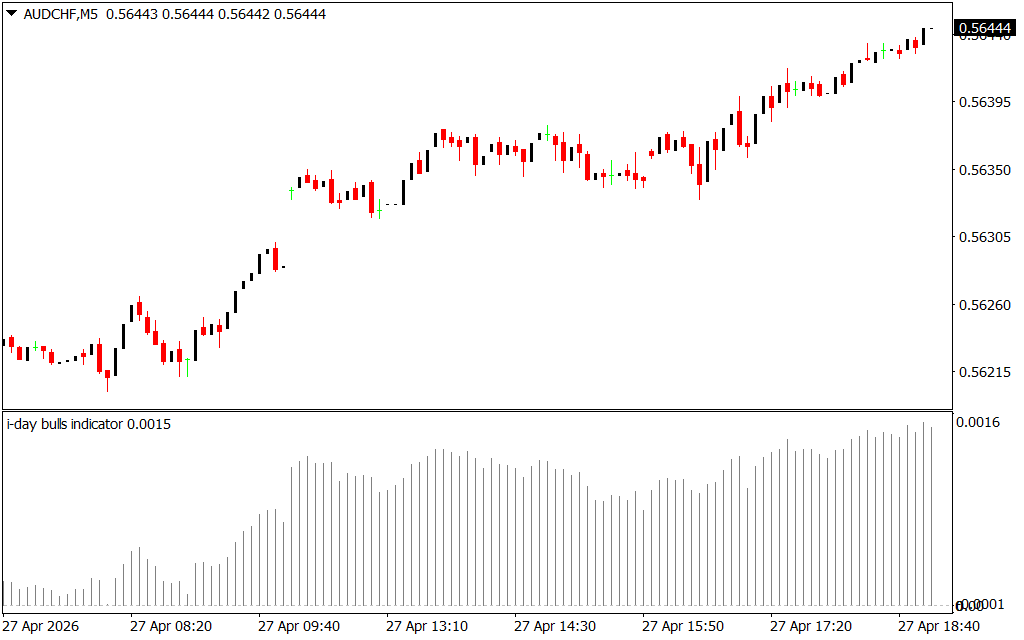
The i-Day Bulls Indicator belongs to the family of power oscillators. It focuses exclusively on the conviction of buyers by measuring the relationship between the period's high and a smoothed moving average of Price Action. Unlike lagging indicators that react slowly to market shifts, the i-Day Bulls version is optimized for intraday timeframes, such as the M5 chart shown for AUD/CHF.
As seen in the provided chart, the indicator appears in a dedicated sub-window as a gray vertical histogram:
- Rising Histogram Bars: Indicate that the bulls are successfully pushing the price higher relative to the average, signaling an acceleration in upward momentum.
- Falling Histogram Bars: Suggest that while the price might still be high, the "conviction" of the buyers is waning, often serving as a leading indicator for a coming pullback.
- Zero Line: Acts as the threshold; when bars are absent or near zero, the market is lacking bullish direction.
Why Intraday Traders Need This Tool
- Spotting Trend Exhaustion: One of the most powerful uses of the i-Day Bulls Indicator is identifying "divergence." If the price makes a new high on the M5 chart but the indicator histogram shows a lower peak, it is a clear warning that the bulls are exhausted.
- Filtering "Fakeouts": During a breakout, the i-Day Bulls histogram should show a sharp spike. If the price breaks a resistance level but the indicator remains flat, it is likely a "fakeout" driven by low volume rather than genuine bullish intent.
- Confirming Entries: When used alongside a trend-following system, this indicator acts as a final confirmation. For a "Buy" trade to be valid, you want to see the histogram bars expanding, proving that the bulls have control of the current session.
Strategic Application: Scaling into Trends
The i-Day Bulls Indicator is exceptionally effective for "buying the dip" during an established uptrend. On the AUD/CHF M5 chart, notice how the histogram naturally contracts during minor price pullbacks. The moment the bars begin to expand again, it signals that the bulls have rejoined the fray, providing a high-probability entry point to join the moving trend.
By focusing purely on the "Bulls" side of the equation, this tool allows traders to strip away market noise and focus on a single, critical question: Are the buyers strong enough to sustain this move?
Conclusion
The i-Day Bulls Indicator is an essential asset for any MetaTrader 4 user looking to refine their intraday strategy. By quantifying buyer conviction through a clean histogram format, it provides the structural clarity needed to navigate complex market cycles with confidence.
1 Download
Last Update:
Apr 27, 2026 22:02 PM
Published:
Feb 01, 2026 12:46 PM
Category: