Riding the Market Cycles: A Deep Dive into the Waves Indicator for MT4
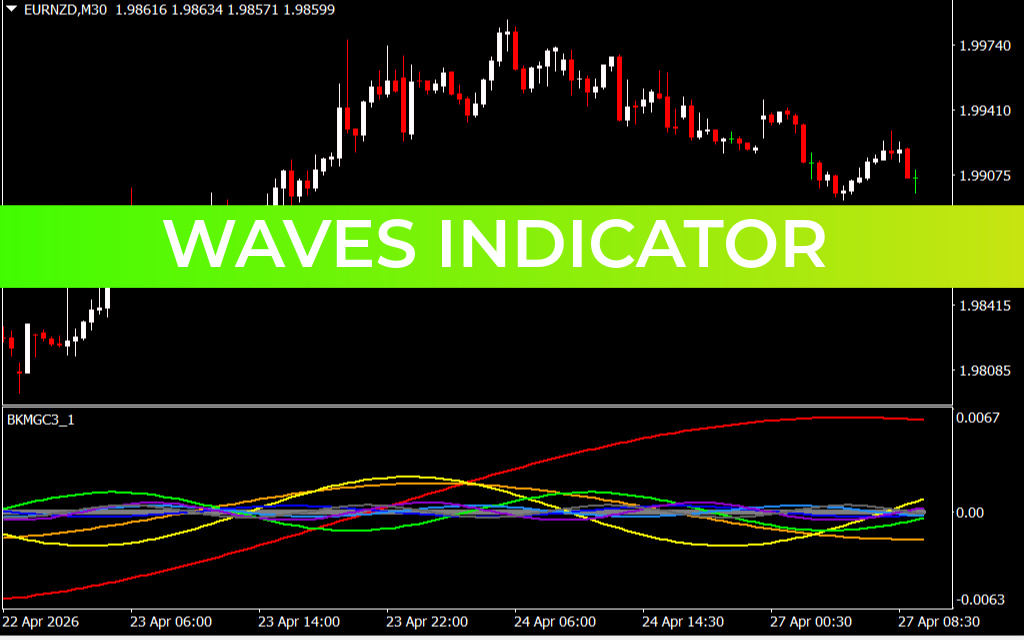
In the complex ecosystem of Forex trading, price movement is rarely linear. Instead, it moves in rhythmic, repetitive cycles known as waves. Understanding these cycles is the difference between catching a massive trend and being stopped out by market noise. The Waves Indicator (often seen in specialized versions like the BKMGC3) is a sophisticated technical tool designed to visualize these underlying market frequencies, helping traders identify high-probability reversal points and trend continuations.
The Science of Market Waves
Market wave theory is rooted in the idea that Price Action reflects the collective psychology of traders. These psychological shifts create distinct "waves" of buying and selling pressure. The Waves Indicator uses complex mathematical algorithms—often involving Fourier transforms or multiple moving average deviations—to plot several lines in a sub-window. Each line typically represents a different cycle length, from short-term scalping momentum to long-term institutional trends.
When these multi-colored waves align, it signals a powerful confluence. For example, if the short-term waves and long-term waves all turn upward from a bottoming position, it indicates a strong "buy" signal where the entire market cycle is in sync.
Strategic Implementation: Reading the Curves
Trading with the Waves Indicator requires a focus on two main elements: Crossings and Expansion.
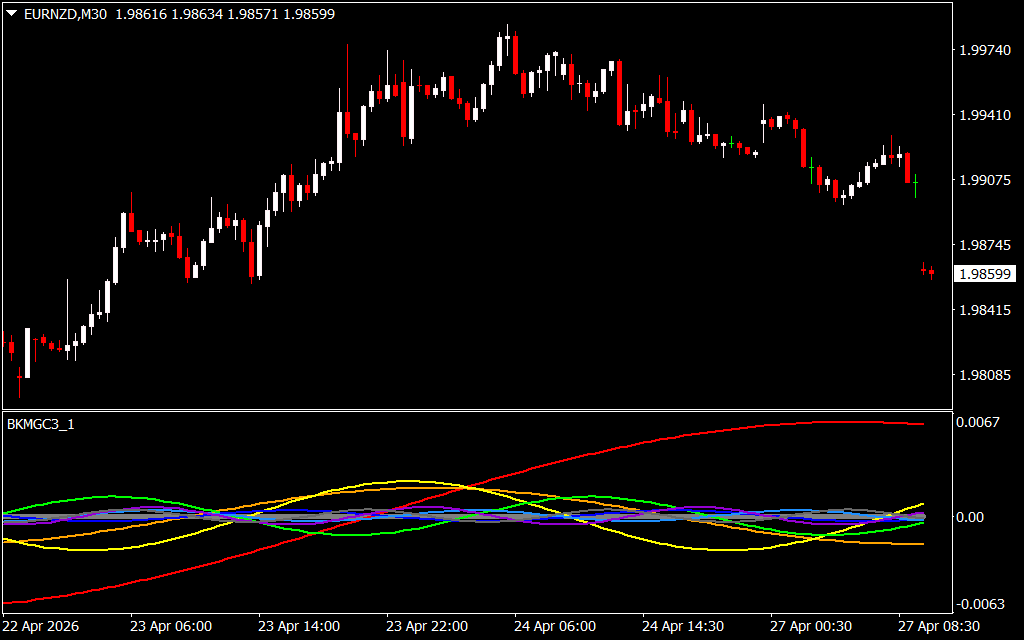
- Wave Convergence & Expansion: When the wave lines are tightly bunched together, the market is usually in a consolidation or "squeeze" phase. When they begin to fan out (expansion), it indicates the start of a strong directional trend.
- The Zero-Line Equilibrium: Much like a standard oscillator, the Waves Indicator often oscillates around a central zero line. Waves rising far above the zero line suggest an overextended bullish market, while waves dipping deep below suggest a bearish exhaustion.
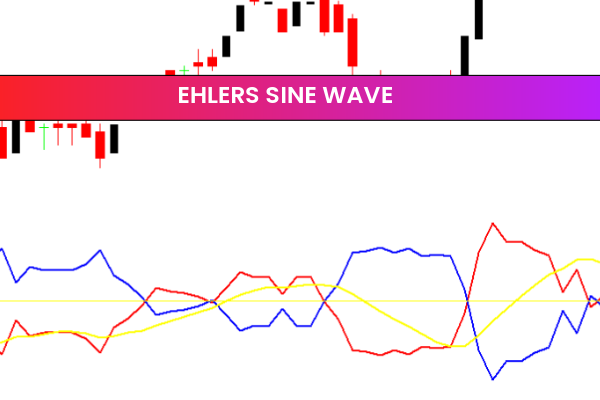
- Color-Coded Momentum: Different colors in the Waves Indicator allow traders to distinguish between "fast" cycles and "slow" cycles at a glance. Watching how a fast wave (e.g., the red line in some versions) reacts compared to the slower yellow or green waves can provide early warning signs of a trend fading.
Why the Waves Indicator is Essential for M30 Traders
On the M30 (30-minute) timeframe, the Waves Indicator is particularly effective at filtering out the "market jitter" found on lower timeframes while still providing more entries than a daily chart. It allows intraday traders to stay positioned in a move as long as the primary waves remain expanded in one direction, preventing premature exits that leave money on the table.
For those trading volatile pairs like EURNZD, the Waves Indicator acts as a stabilizing force. It helps you ignore minor price spikes and focus on whether the underlying cycle has actually shifted. By integrating this tool into your MetaTrader 4 setup, you transition from "guessing" the next move to "reading" the natural flow of market liquidity.egy.
1 Download
Last Update:
Apr 27, 2026 15:50 PM
Published:
Feb 01, 2026 13:43 PM
Category: