Mastering Market Swings with the ZZ Orlova Indicator for MT4
In the world of technical analysis, Price Action is often cluttered with "market noise"—minor fluctuations that obscure the primary trend and lead to trader fatigue. To combat this, professional traders utilize zigzag-style indicators to filter out the static and focus on significant price movements. The ZZ Orlova Indicator is a premier tool in this category, designed to highlight major swing highs and lows with mathematical precision, making it an essential asset for wave theorists and trend followers alike.
What is the ZZ Orlova Indicator?
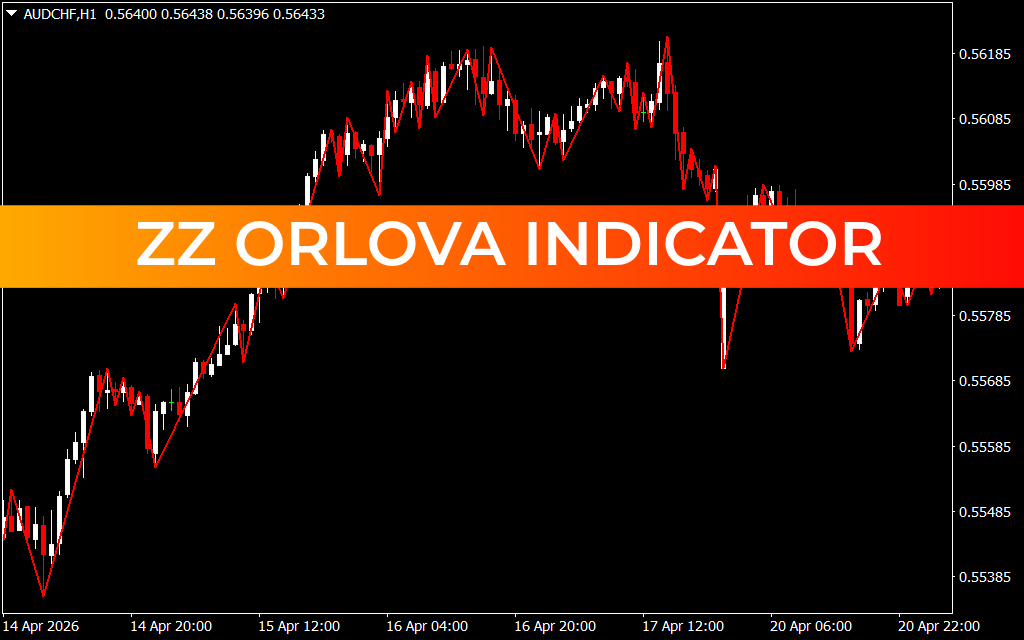
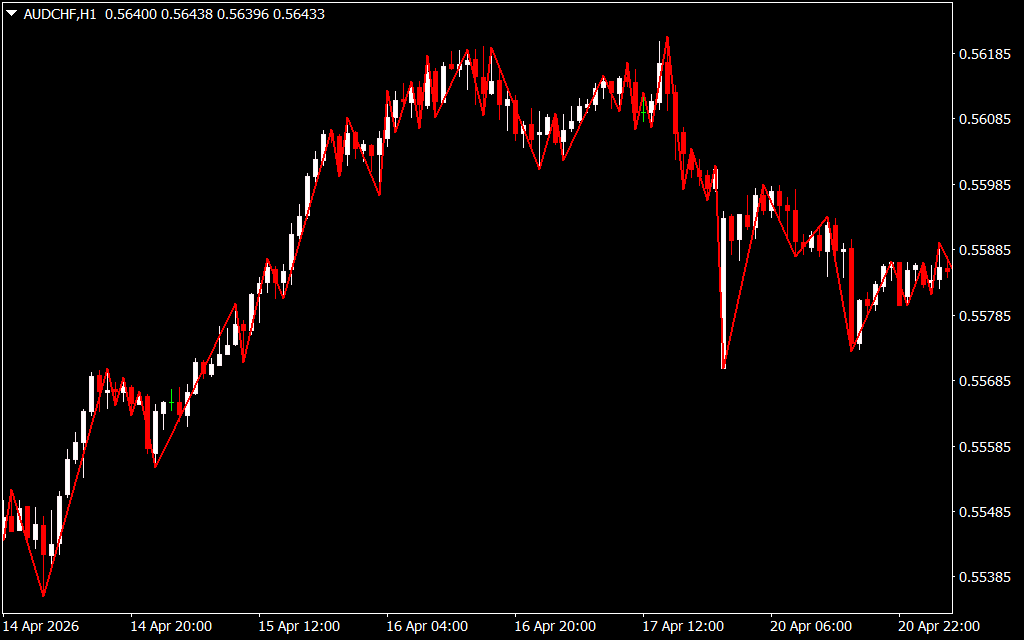
The ZZ Orlova is a modified version of the classic ZigZag indicator. While the standard version often suffers from excessive repainting or lag, the Orlova variation utilizes a refined algorithm to connect significant price peaks and troughs. As shown in the AUD/CHF H1 chart, the indicator appears as a continuous red line that "zigs" and "zags" across the price action, creating a clear map of the market's skeletal structure.
By ignoring price movements that do not meet a specific percentage or pip threshold, the ZZ Orlova allows traders to see:
- True Support And Resistance: The points where the red line changes direction are the areas where the market has historically reversed.
- Trend Direction: A sequence of higher highs and higher lows (as seen in the early part of the chart) confirms a healthy uptrend.
- Chart Patterns: It makes identifying Head and Shoulders, Double Tops, and Triangles nearly effortless by connecting the dots of price action.
Why the Orlova Version is Superior
Many traders shy away from standard zigzags because they fear "repainting"—the shifting of the last line as price makes a new high or low. The ZZ Orlova addresses this by providing more stable transition points. It is particularly effective for:
- Elliott Wave Analysis: Counting waves is notoriously difficult on a raw candle chart. The ZZ Orlova provides a clean visual guide for identifying motive and corrective waves.
- Fibonacci Placement: To draw accurate Fibonacci retracements, you must know exactly where a swing begins and ends. This indicator removes the guesswork, showing you the precise anchors for your levels.
- Stop Loss Placement: Professional traders often place stop losses just beyond the most recent swing point. The ZZ Orlova highlights these "structural" levels, helping you set stops that are less likely to be hit by random volatility.
Trading Strategy: The Trend Break
A powerful way to use the ZZ Orlova is to watch for the break of the most recent "Zag." If the indicator has been making higher lows and then suddenly produces a lower low that breaks the previous red line trough, it signals a potential Trend Reversal. This allows traders to exit long positions or enter short trades at the very beginning of a new market cycle.
Conclusion
The ZZ Orlova Indicator is more than just a line on a chart; it is a clarity tool. By stripping away the distractions of daily volatility, it allows you to trade based on Market Structure rather than emotion. Whether you are a scalper on the M1 timeframe or a swing trader on the H1, the ZZ Orlova provides the structural foundation needed for a professional trading system.
1 Download
Last Update:
Apr 27, 2026 21:50 PM
Published:
Feb 01, 2026 12:55 PM
Category: