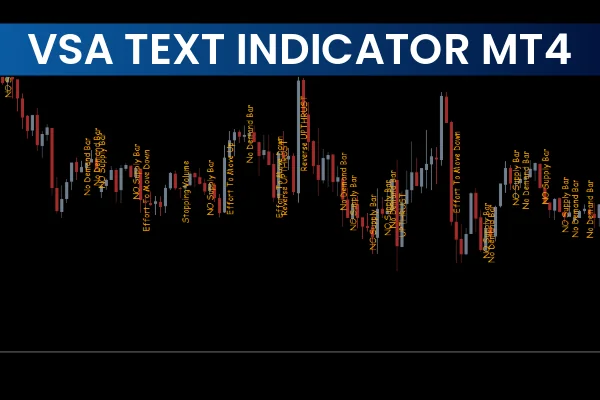
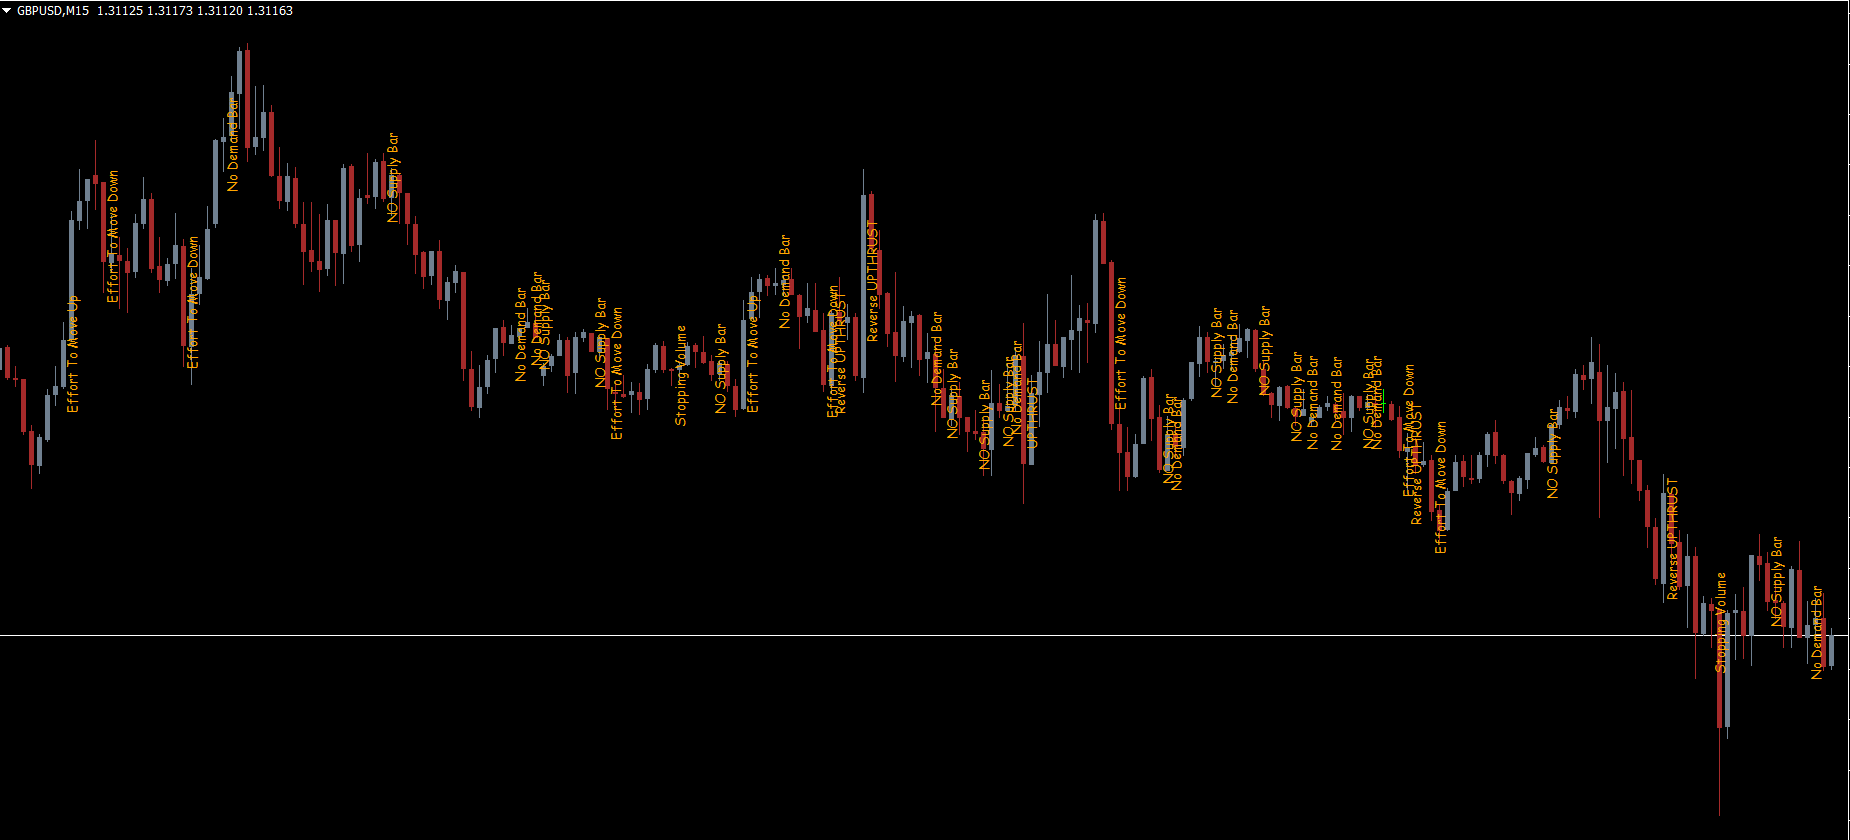
The VSA Text indicator for MT4 is a powerful tool based on Volume Spread Analysis (VSA), allowing traders to interpret market activity using a combination of price spread and volume behavior. Instead of showing regular signals, the indicator prints vertical text labels on the chart such as no supply, no demand, effort to move up, effort to move down, reverse upthrust, and stopping volume. These labels help traders quickly understand whether buyers or sellers are dominating the market.
Because the indicator visually identifies changes in Supply And Demand, it becomes easier to determine when a trend is strengthening, weakening, or preparing for reversal.
What Each VSA Text Signal Means
No Supply Bar
Indicates buyers are not actively pushing the market.
Signals potential bearishness or trend weakness.
No Demand Bar
Shows sellers are not interested in driving price lower.
Signals potential bullishness or Trend Reversal to the upside.
Effort to Move Up
Displays when price pushes upward with noticeable activity.
Suggests bullish pressure.
Effort to Move Down
Displays when price pushes downward with activity.
Suggests bearish pressure.
Upthrust / Reverse Upthrust
Upthrust: Often marks a potential bearish reversal.
Reverse upthrust: Can signal a potential bullish reversal.
Stopping Volume
Appears when there is little to no volume.
Indicates a pause in market activity, often before a shift.
These signals help traders understand the true intentions of market participants by analyzing volume relative to price movement.
How to Trade with the VSA Text Indicator
The indicator’s signals revolve around supply and demand imbalances. By reading these text labels as the market moves, traders can anticipate Trend Continuation or reversal more confidently.
Key Trading Logic
No Supply = Possible Downtrend
No Demand = Possible Uptrend
Upthrust = Bearish Reversal Warning
Reverse Upthrust = Bullish Reversal Warning
Effort to Move Up/Down = Confirms Market Sentiment
To improve accuracy, traders should combine the VSA Text indicator with:
Trendlines
Additional volume indicators
Candlestick confirmation
The indicator is compatible with all timeframes, although shorter timeframes may generate more false signals.
VSA Text Indicator Buy Setup
Identify a no demand bar on the chart.
Wait for the uptrend to show structure and momentum.
Enter a buy trade when the uptrend confirms.
Place the stop-loss near the low of the signal candle.
Exit the trade when a no supply bar or effort to move down appears.
VSA Text Indicator Sell Setup
Identify a no supply bar on the chart.
Wait for the downtrend to be clearly formed.
Enter a sell trade at the no supply bar.
Place your stop-loss above the high of the signal candle.
Exit the trade when a no demand bar or effort to move up appears.
Conclusion
The VSA Text indicator for MT4 is a highly useful tool for understanding volume dynamics and market intent. By showing text-based signals such as no supply, no demand, and upthrusts, it provides valuable insights into market sentiment. Although it can produce misleading signals on smaller timeframes, combining it with other technical tools significantly improves its reliability.
FAQ
Published:
Nov 19, 2025 09:20 AM
Category: