Trend trading is one of the most profitable forex strategies because financial markets naturally move in identifiable trends. Traders rely on swing highs, swing lows, and Market Structure to determine whether a bullish or bearish direction is dominant. Many tools exist to help traders read trends, but they can often be complicated—especially for beginners. The Price Channel Signal Indicator for MT5 simplifies trend trading by clearly highlighting trend direction and potential trade entry zones.
H2: What Makes Trend Trading So Effective?
Trend trading capitalizes on one of the market’s most reliable behaviors: directional movement. Whether on a 5-minute chart or a monthly timeframe, price creates waves—forming higher highs in an uptrend or lower lows in a downtrend.
The Challenge of Traditional Trend Analysis
Although trend reading sounds simple, many traders struggle. Identifying key levels, swing points, and changes in market sentiment can be overwhelming. This is why indicators that visualize trend shifts—like the Price Channel Signal Indicator—are exceptionally helpful.
Overview of the Price Channel Signal Indicator for MT5
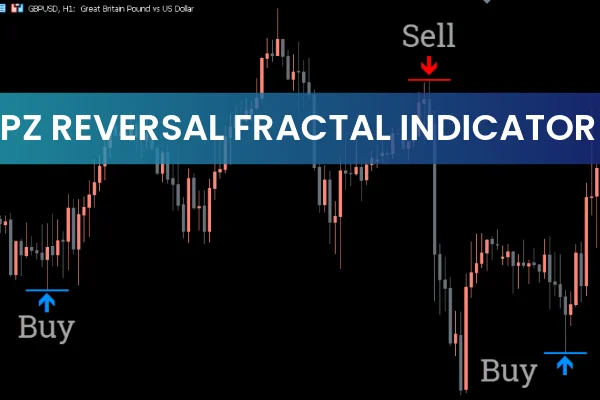
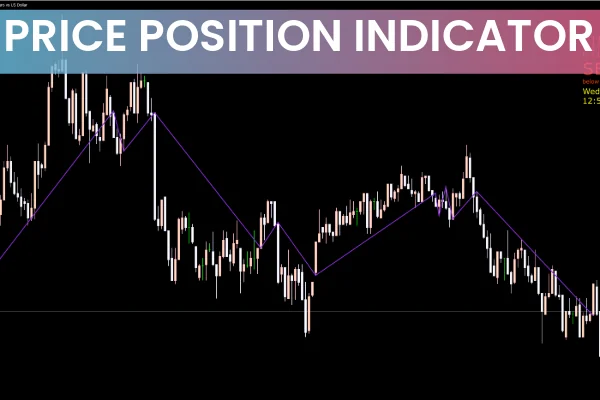
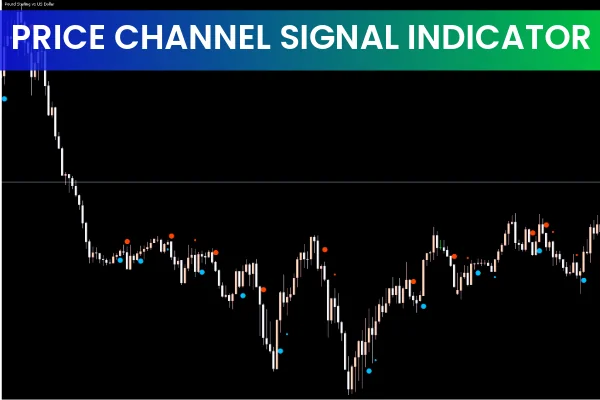
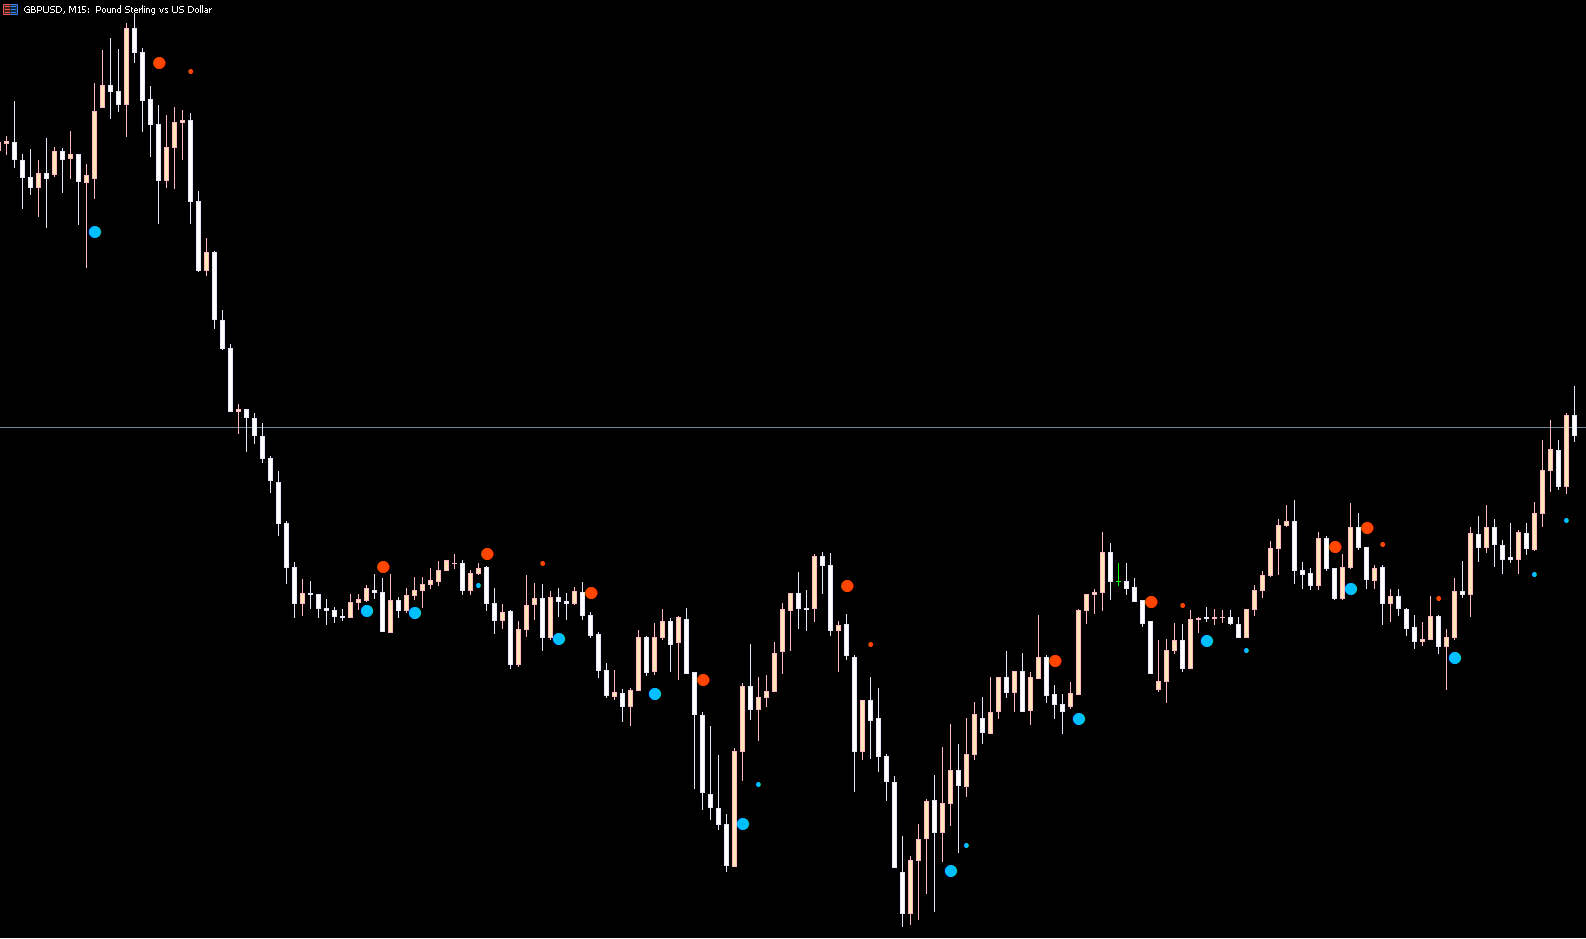
The Price Channel Signal Indicator helps traders quickly identify major swing highs and lows, enabling them to understand whether the market is currently trending upward or downward. It displays colored dots along the chart:
Red dots signal a potential downtrend, suggesting sell opportunities.
Aqua dots mark a potential uptrend, signaling buy opportunities.
This visual approach eliminates confusion and supports faster, more confident decision-making.
Works on All Timeframes and Market Conditions
One of the greatest strengths of this indicator is its versatility. Whether you're a scalper, intraday trader, swing trader, or position trader, it adapts to any timeframe. It also performs well in trending and ranging markets:
Trend traders can identify dynamic support and resistance zones.
Range traders can easily see potential reversal points.
This makes it ideal for forex traders of all skill levels.
How to Use the Price Channel Signal Indicator Effectively
While the indicator can be used alone, combining it with Price Action and market structure analysis significantly increases accuracy.
Example: Using the Indicator on AUD/USD H4
Consider a downtrend on the AUD/USD H4 chart. When price touches the upper trendline and forms a doji candle, the indicator prints a red dot. This alignment provides a clear sell signal. A recommended stop-loss could be placed above the swing high.
Conversely, when price reaches the lower trendline and forms a bullish engulfing candle, the indicator prints an aqua dot, signaling a potential buy. A stop-loss can be placed safely below the structure low.
Trades should be exited when the indicator changes color, signaling a shift in directional bias.
Why the Price Channel Signal Indicator Improves Trend Trading
The main benefit is clarity. Instead of second-guessing market direction, traders receive visual cues that confirm trend alignment. Additional advantages include:
Easy identification of trend continuation and reversals
Clear visual swing levels
Compatibility with other strategies and indicators
Ideal for beginners and professional traders alike
By simplifying the analytical process, traders spend less time interpreting charts and more time executing high-quality decisions.
Final Thoughts
The Price Channel Signal Indicator for MT5 is a powerful tool for traders seeking accuracy and simplicity. Its ability to reveal trend direction, dynamic zones, and potential entry points makes it a valuable addition to any trading system. While it works alone, combining it with price action and structure analysis yields the best results.
To explore more professional indicators and trading tools, visit IndicatorForest.com today.
FAQ
2 Downloads
Published:
Nov 18, 2025 20:21 PM
Category: