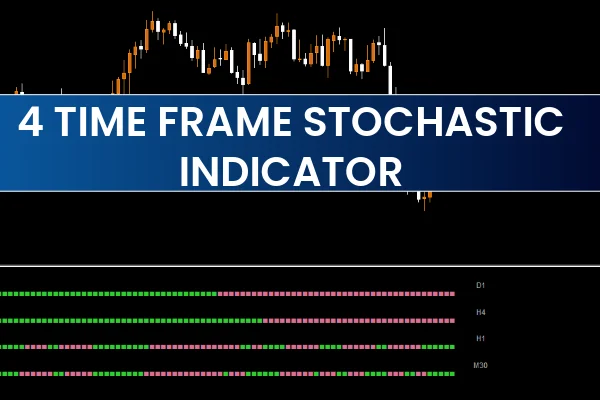
The Stochastic Oscillator is a Momentum Indicator that compares a security’s closing price to its price range over a specific period. It helps traders determine overbought and oversold conditions in the market.

The 4 Time Frame Stochastic Indicator for MT4 enhances this classic concept by showing stochastic readings for:
The current chart timeframe, and
The next three higher timeframes (for example, if you are on M15, it will include M30, H1, and H4).
Each timeframe is represented by a line on the chart, allowing traders to easily visualize when multiple timeframes agree on a direction.
Time Frame Stochastic Indicator for MT4 Trading Signals
The indicator plots four colored lines, each representing one timeframe’s Stochastic value. In addition, it uses green dots for bullish signals and red dots for bearish signals.
Buy Signal (Bullish Setup):
When three or more timeframes show green dots, it indicates a strong bullish condition.
Traders can enter a buy position and hold it until three or more timeframes switch to red.
Stop Loss: Below the recent swing low.
Take Profit: At the next resistance level or opposite signal.
Sell Signal (Bearish Setup):
When three or more timeframes show red dots, it signals bearish momentum.
Traders can enter a sell position and close it when three or more timeframes turn bullish.
Stop Loss: Above the recent swing high.
Take Profit: At the next support level or opposite signal.
Example:
If you are trading on the M15 chart, and the M15, M30, and H1 stochastic all turn green, it confirms a strong bullish setup with momentum aligning across multiple timeframes.
Key Features
Displays stochastic data from 4 different timeframes
Alerts traders when multiple timeframes align with the same signal
Green dots for bullish signals, Red dots for bearish signals
Non-repainting indicator (signals remain fixed after candle close)
Works on all timeframes and instruments — forex, indices, commodities, and crypto
Suitable for Scalping, day trading, and swing trading
How to Use the 4 Time Frame Stochastic Indicator Effectively
Identify Market Direction:
Check which direction the majority of timeframes are signaling. If most are bullish (green), focus on buy trades; if bearish (red), focus on sells.
Confirm with Price Action:
Combine stochastic signals with Support And Resistance levels, trendlines, or candlestick patterns for higher accuracy.
Avoid Overtrading:
Wait for three or more timeframes to align before entering a trade — this helps filter out weak or conflicting signals.
Exit Strategy:
Exit when the indicator shows opposite signals on most timeframes, or use a favorable risk-reward ratio (e.g., 1:2 or 1:3).
Why Multi-Timeframe Analysis Matters
Multi-timeframe analysis (MTF) helps traders see the bigger market picture. For instance, even if a short-term chart (like M5) shows a buy signal, a higher timeframe (like H1 or H4) may still be in a downtrend. The 4 Time Frame Stochastic Indicator bridges this gap by displaying all key timeframes together.
This not only reduces false entries but also improves trend confirmation, making it one of the most powerful tools for traders who rely on momentum and timing.
Conclusion
In summary, the 4 Time Frame Stochastic Indicator for MT4 is an effective and profitable multi-timeframe trading tool that enhances the classic Stochastic Oscillator. By combining stochastic data from four timeframes into a single chart, traders can make more confident and precise trading decisions.
It provides accurate buy and sell signals, works on all instruments, and does not repaint, making it ideal for scalpers, day traders, and swing traders alike.
Download the 4 Time Frame Stochastic Indicator for MT4 for free from IndicatorForest.com and experience the power of multi-timeframe stochastic trading today.
FAQ
1 Download
Published:
Nov 06, 2025 15:01 PM
Category: