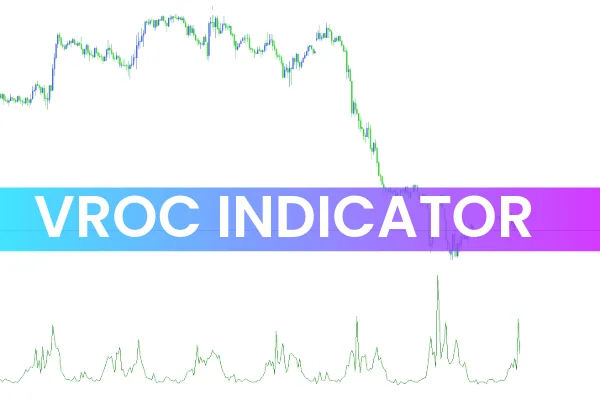
The Volume Rate of Change (VROC) Indicator for MetaTrader is a volume-based momentum tool that measures the rate at which trading volume changes over time. It provides valuable insight into the strength behind market moves, helping traders confirm breakouts, trend continuations, and potential reversals.
The indicator calculates the percentage change in volume over a selected period (N), which can represent days, weeks, or months, depending on the trading style. The result is plotted in a separate window below the main chart as a fluctuating line or histogram, showing whether market participation is increasing or decreasing.
By analyzing these fluctuations, traders can gauge market enthusiasm — a key factor in confirming the sustainability of price trends.
The VROC indicator uses a straightforward yet powerful formula:
VROC=(Volumetoday−Volumen periods ago)Volumen periods ago×100VROC = \frac{(Volume_{today} - Volume_{n\ periods\ ago})}{Volume_{n\ periods\ ago}} \times 100VROC=Volumen periods ago(Volumetoday−Volumen periods ago)×100
This calculation expresses how quickly the trading volume is rising or falling relative to past periods.
High positive VROC → Indicates increasing buying or selling pressure (momentum buildup).
Low or negative VROC → Suggests slowing volume, indicating consolidation or weakening trend strength.
The indicator is designed to work across all timeframes — from short-term scalping on the M1 chart to long-term analysis on daily or weekly charts.
The VROC does not directly generate buy or sell signals; instead, it acts as a confirmation tool for other indicators or price action strategies. Here’s how you can use it effectively:
When price approaches a key support or resistance level, a sharp increase in VROC indicates rising market participation.
Buy Setup: If price breaks above resistance with a high VROC spike, it suggests a strong bullish breakout.
Sell Setup: If price breaks below support with a rising VROC, bearish momentum is strong.
Tip: Confirm breakouts by observing simultaneous increases in both price and volume change.
A low VROC value signals that trading activity is slowing down — often a precursor to trend exhaustion or price reversal.
If price continues rising but VROC declines, it shows bullish momentum weakening (possible reversal).
If price keeps falling while VROC drops, bearish pressure is fading (potential bottom).
Combining VROC with support/resistance or candlestick patterns improves reversal accuracy.
When VROC stays flat for an extended period, it indicates low participation — typical of sideways or consolidating markets.
During such times, traders should wait for a VROC surge before entering a trade, as that often marks the start of a new directional move.
For enhanced trading precision, pair the VROC with:
Trend indicators like Moving Averages or the MACD to confirm direction.
Momentum tools like RSI or Stochastic to verify overbought/oversold conditions.
Volume-based tools like the On-Balance Volume (OBV) for deeper confirmation of trend strength.
This combination allows you to spot volume-driven price breakouts and avoid false signals in low-liquidity periods.
Reveals Volume Momentum: Helps identify shifts in buying/selling pressure.
Early Trend Detection: Anticipates potential breakouts before price movement confirms them.
Versatile Use: Works on all markets — Forex, stocks, commodities, and crypto.
Customizable Periods: Traders can adjust the “N” period to suit scalping, intraday, or swing strategies.
Ideal Confirmation Tool: Perfect for combining with price action and technical setups.
Beginner Friendly: Simple to interpret even for new traders.
Short-Term Trading (Scalping): Use a smaller N-period (5–10) to detect rapid volume changes.
Intraday or Swing Trading: Set N between 14–25 periods for smoother, more reliable signals.
Long-Term Analysis: Use larger periods (50–100) to identify macro trend momentum.
The Volume Rate of Change (VROC) Indicator for MetaTrader is one of the most effective volume analysis tools for detecting market momentum and participation strength. By observing how quickly volume changes, traders can confirm breakouts, identify false moves, and anticipate reversals with higher confidence.
Although VROC doesn’t generate buy/sell arrows, its insights are invaluable when used as confluence with other indicators or price action techniques.
Download the VROC Indicator for MT5 or MT4 today from IndicatorForest.com and elevate your market analysis with advanced volume-based insights.
Published:
Nov 06, 2025 12:14 PM
Category: