The Gann Swings XVI Indicator for MT4 is a powerful trading tool that filters out short-term price fluctuations to reveal the major market trends. By eliminating minor market noise, this indicator helps traders identify and follow the dominant swing movements for more accurate and profitable trading decisions.
Developed using Gann theory, the indicator automatically plots Gann lines and swing signals, allowing forex traders to focus on long-term price direction instead of short-lived reversals. This makes it an ideal tool for swing traders who prefer holding trades for extended periods to capture significant price moves.
Understanding the Gann Swings XVI Indicator
The Gann Swings XVI Indicator MT4 works on all time frames, but it’s most effective on higher ones such as H4, Daily, or Weekly charts, where market noise is reduced, and clearer swings emerge.
It automatically identifies higher highs and higher lows in an uptrend and lower highs and lower lows in a downtrend. By combining these price structures with its color-coded dot system, the indicator simplifies trend identification for both beginners and advanced traders.
New traders should understand basic Gann Line concepts, while experienced traders can easily interpret the plotted signals for accurate entry and exit points.
How the Gann Swings XVI Indicator Generates Trading Signals
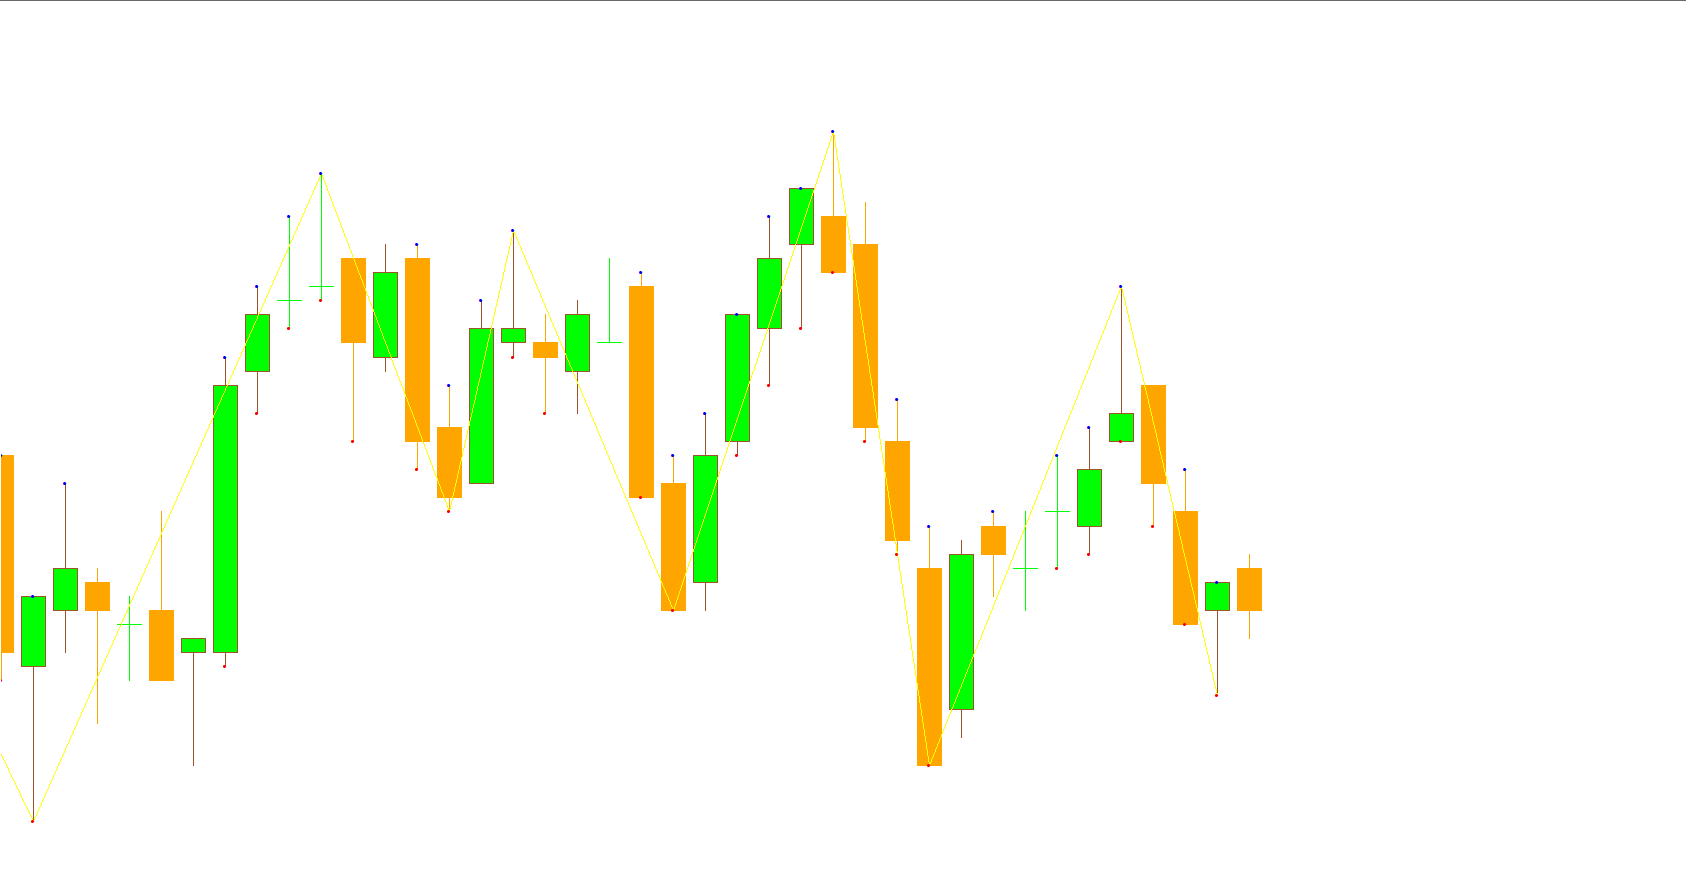
The indicator plots Aqua and Pink dots on the price chart to represent bullish and bearish swings respectively:
Aqua Dots: Indicate bullish swing trading signals. When price forms higher highs and higher lows, traders can look for aqua dots as a confirmation to enter a buy trade. A stop loss should be placed just below the previous swing low.
Pink Dots: Represent bearish signals. When price makes lower lows and lower highs, the presence of pink dots indicates a potential sell opportunity. A stop loss can be set above the previous swing high.
Since the Gann Swings XVI Indicator does not provide fixed profit targets, traders can manage open positions based on trailing stops or major support/resistance zones to maximize profit potential.
Trading Strategy Example
Let’s consider a practical setup using the EURUSD H4 chart. When the price begins forming higher highs and higher lows with Aqua dots appearing beneath the candlesticks, this indicates a bullish swing. Traders can open a buy position and ride the trend until opposite (pink) dots appear.
Conversely, when the market starts forming lower lows and lower highs along with Pink dots, traders can enter short positions and hold until a change in trend direction is confirmed.
Benefits of the Gann Swings XVI Indicator for MT4
Identifies Major Trends: Filters out small fluctuations to highlight dominant market direction.
Swing Trader Friendly: Perfect for traders aiming to capture larger price movements.
Simple Visual Cues: Pink and Aqua dots make it easy to recognize trend shifts.
Works on All Time Frames: Adaptable to intraday, swing, and long-term strategies.
Free and Easy to Use: Available for download at IndicatorForest.com.
Conclusion
The Gann Swings XVI Indicator MT4 is a must-have tool for forex traders who follow Gann theory or trade using swing strategies. By visually representing market trends through color-coded signals, it helps eliminate noise and provides clarity in trade decision-making.
Whether you are a beginner learning Gann analysis or an experienced swing trader, this indicator simplifies the process of identifying profitable trading opportunities. To download the Gann Swings XVI Indicator for MT4, visit IndicatorForest.com and explore more free MT4 trading tools.
FAQ
3 Downloads
Published:
Nov 09, 2025 04:40 AM
Category: