The 3TF RSI Average Indicator for MT5 is a versatile technical tool that plots the Relative Strength Index (RSI) for three different timeframes and calculates their average. This multi-timeframe approach allows traders to capture both fast market movements on lower timeframes and smoother signals on higher timeframes.
By averaging RSI readings from multiple timeframes, the indicator reduces noise and provides clearer insights into market trends and potential reversal points. It works on any currency pair and timeframe, making it suitable for scalpers, day traders, and swing traders alike. For timeframes above H1, users can customize settings to select which RSI lines to display for optimal clarity.
How the 3TF RSI Average Indicator Works
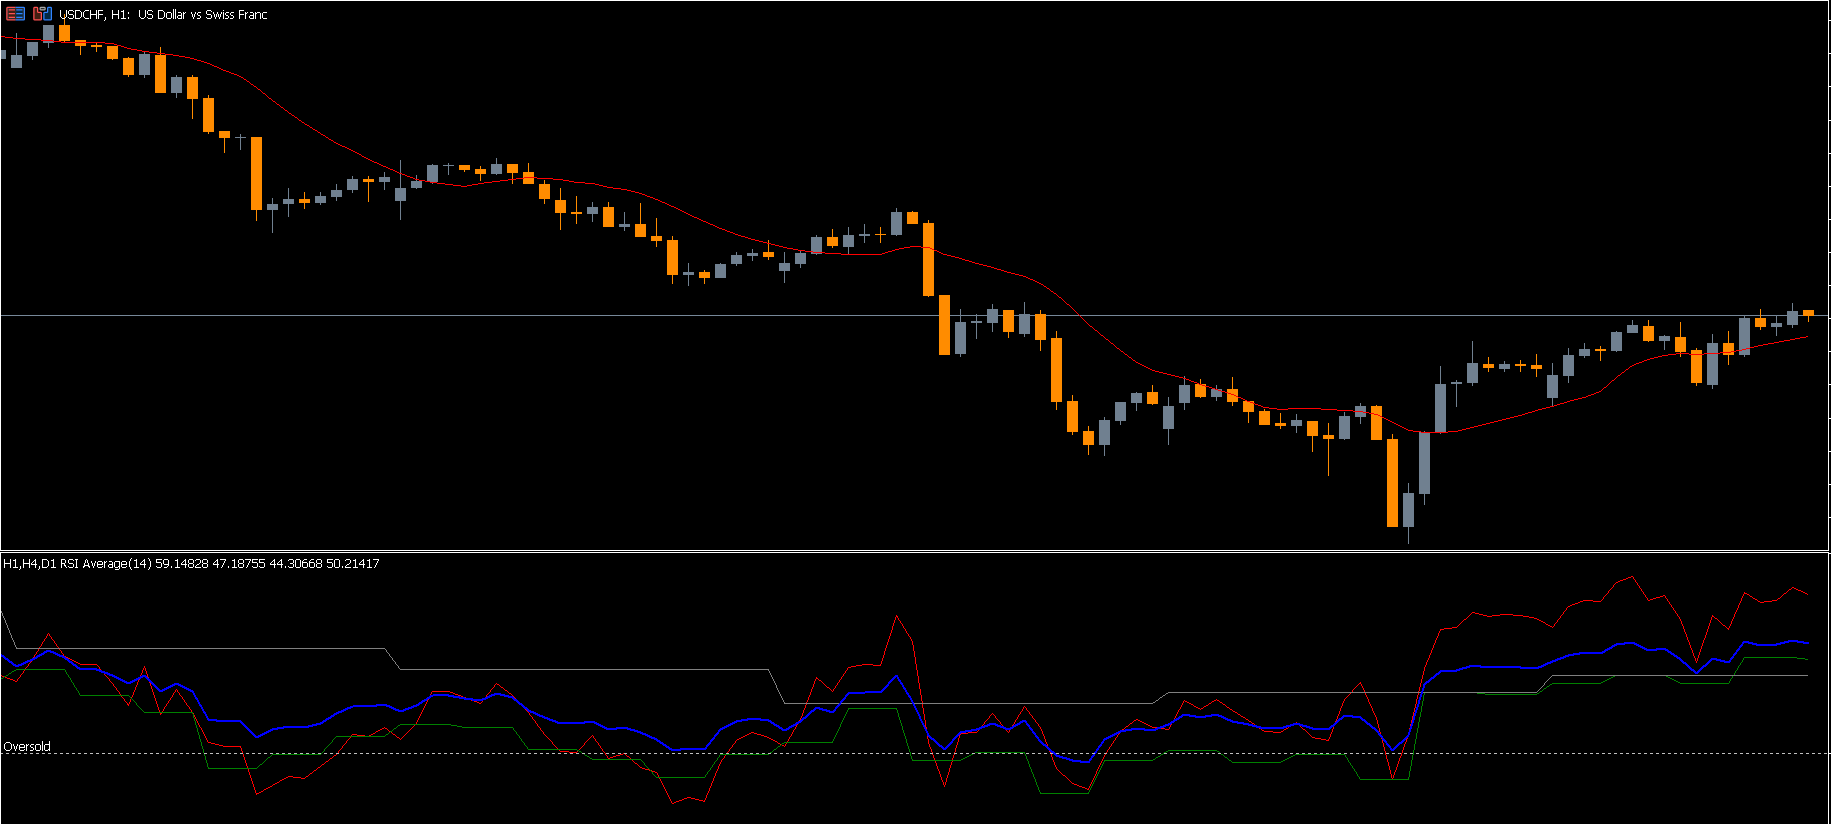
The indicator displays four lines in a separate indicator window below the price chart:
Red Line: RSI from the H1 timeframe
Green Line: RSI from the H4 timeframe
Orange Line: RSI from the D1 timeframe
Thicker Blue Line: Average of the three RSI lines, which acts as the main trading signal
This setup helps traders track short-term momentum while keeping an eye on longer-term market trends.
How to Trade Using the 3TF RSI Average Indicator
Identifying Oversold and Overbought Conditions
The main blue line provides signals for potential trend reversals:
Oversold (Below 30): Indicates a potential bullish reversal. Traders should wait for price confirmation before entering a long position. Place a stop-loss below the previous swing low and take profit according to your risk/reward strategy.
Overbought (Above 70): Indicates a potential bearish reversal. Wait for price confirmation before opening a short position. Set stop-loss slightly above the previous swing high and determine take profit using your RR strategy.
Trade Confirmation
Although the blue line indicates potential reversals, it is recommended to combine signals with Price Action analysis or other indicators such as moving averages or trendlines. This reduces the likelihood of false entries.
Multi-Timeframe Analysis Advantage
By combining three timeframes, traders get a comprehensive view of the market:
Lower Timeframes (H1): Capture quick market movements for precise entry points.
Higher Timeframes (H4, D1): Reduce noise and confirm overall trend direction.
This balanced approach improves the probability of successful trades while minimizing market noise impact.
Trading Example: GBP/USD H1 Chart
On the GBP/USD H1 chart, the indicator displays four lines. When the blue average line dips below the 30 oversold level, a bullish reversal is likely. After confirming price action, traders can enter a long trade with stop-loss placed below the swing low.
Conversely, when the blue line rises above 70 overbought, a bearish reversal may occur. After confirmation, traders can enter a short trade, with stop-loss set above the previous swing high.
Why Use the 3TF RSI Average Indicator?
Multi-Timeframe Clarity: Combines short-term and long-term RSI trends for better signal accuracy.
Reduced Noise: Averaging multiple timeframes smooths erratic price movements.
Flexible Application: Works on any currency pair and timeframe.
Free to Download: Easily accessible for all traders looking to improve their strategy.
Conclusion
The 3TF RSI Average Indicator for MT5 provides a reliable method for identifying trend direction and reversal points by combining three RSI timeframes into a single averaged signal. While effective on its own, it works best when paired with other indicators or price action confirmation.
You can download the 3TF RSI Average Indicator for free at IndicatorForest.com and start using it to enhance your forex trading strategy today.
FAQ
5 Downloads
Published:
Nov 17, 2025 09:24 AM
Category: