The Price Channel Indicator is built around simple but powerful mechanics. It examines the highest high and lowest low within a user-defined period—commonly 14 candles—to determine the boundaries of market movement.
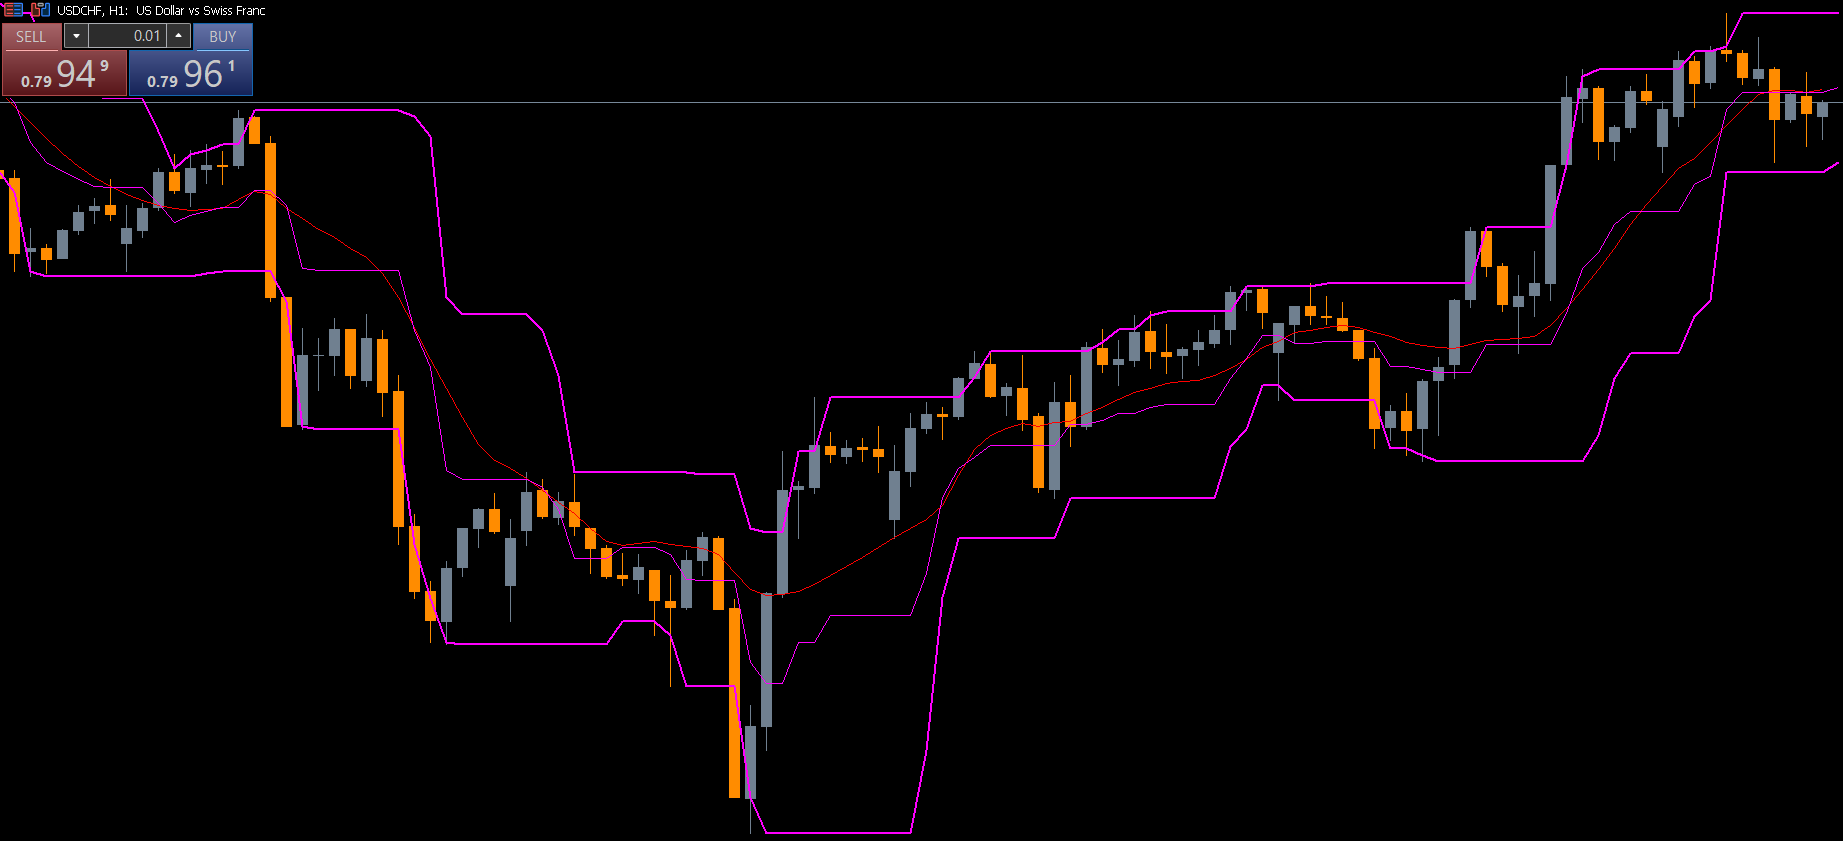
Upper Price Channel
This line represents the highest high in the selected period. When price breaks above this level, it may indicate strong buying pressure and a potential bullish breakout.
Lower Price Channel
This line reflects the lowest low in the selected period. A break below the lower channel often signals increased selling momentum and potential for bearish continuation.
Middle Channel Line
This line is the midpoint between the upper and lower channels. It acts as a balance level or a dynamic support/resistance and is useful for identifying trend pullbacks or price equilibrium zones.
Price Channel Indicator Trading Signals
The Price Channel Indicator generates several trading signals that help traders analyze price behavior and make informed trading decisions.
Breakout Trading Signals
Breakouts are the most common use of the indicator.
Bullish Breakout
When price closes above the upper channel, it suggests momentum is rising. Traders may enter buy trades with stops placed below the middle or lower channel.
Bearish Breakout
When price closes below the lower channel, it indicates bearish strength. Sell trades can be placed with stops above the middle or upper channel.
Breakouts work best in trending markets and during high-volatility sessions.
Reversal Trading Signals
Sometimes, price fails to sustain movement outside the channel, leading to false breakouts and reversal.
Traders look for:
Wick rejection at channel boundaries
Candlestick reversal patterns
Divergence with oscillators
These signals can offer early entries for counter-trend setups.
Trend Continuation Signals
The middle trendline is crucial for trend continuation analysis.
In an uptrend, price often pulls back to the middle line before bouncing upward.
In a downtrend, the middle line acts as resistance.
Traders use this behavior to enter trades during corrections instead of chasing price.
How to Use the Price Channel Indicator Effectively
Choose the Right Timeframe
The indicator works on all timeframes, but:
M1–M15: Scalping breakouts
M30–H1: Intraday trading
H4–D1: Swing trading and long-term trend analysis
Combine with Other Indicators
To improve accuracy, traders often combine the Price Channel Indicator with:
RSI or Stochastic (for overbought/oversold conditions)
ADX (to confirm Trend Strength)
EMA/MA (for directional bias)
Risk Management
Breakout strategies may produce false signals. Always:
Set stop-loss beyond channel lines
Avoid trading during low-volatility periods
Use trailing stops to secure profit during strong trends
Conclusion
The Price Channel Indicator is a versatile tool that helps traders identify breakout levels, trend direction, and reversal zones. Its straightforward structure makes it suitable for beginners while still offering advanced insights for professional traders. Whether you focus on trend continuation or breakout strategies, the Price Channel Indicator can significantly enhance your trading performance.
To download more indicators, EAs, and premium trading tools, visit IndicatorForest.com today.
FAQ
5 Downloads
Published:
Nov 19, 2025 03:31 AM
Category: