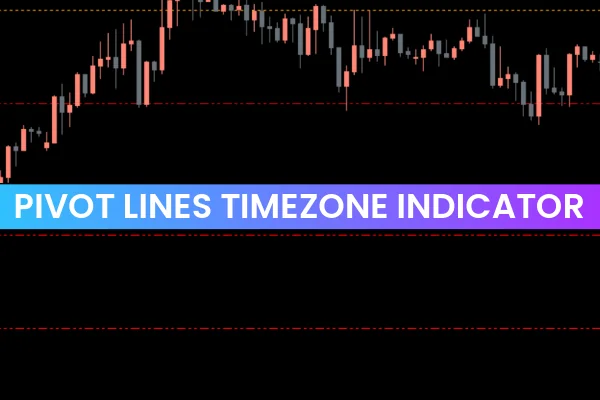
Understanding market trends and key price levels is essential for Forex trading success. The Pivot Lines TimeZone indicator for MetaTrader 4 is designed to help traders identify major market trends by analyzing daily and historical Price Action. This tool provides a visual representation of highs, lows, opening/closing prices, and pivot points directly on the chart.
Unlike typical pivot indicators, the Pivot Lines TimeZone indicator combines traditional pivot levels with Camarilla points and midpoints, giving traders a clear picture of potential support and resistance zones.
How Pivot Lines TimeZone Works
The indicator draws reference lines for a selected timeframe and displays key price information:
Current and Previous Day Highs and Lows
Daily Ranges
Opening and Closing Prices
Camarilla Points and Midpoints
By mapping out these levels, traders can visually interpret the market’s direction and key price zones for trend-following or counter-trend strategies.
Although the indicator does not generate direct BUY or SELL signals, it serves as an essential guide for determining potential Support And Resistance. For trade entries and exits, it is recommended to combine the Pivot Lines TimeZone with momentum oscillators such as RSI or MACD.
Using Pivot Reference Lines
Pivot levels act as support and resistance:
Support: If the price approaches a pivot level from above, it may act as a floor preventing further decline.
Resistance: If the price approaches a pivot from below, it may act as a ceiling preventing further rise.
Traders often monitor these levels for potential breakouts or reversals. Observing price action around these zones can help confirm a strong trend or an impending reversal.
The indicator works best on longer timeframes, but it can also provide useful insights for intraday trading.
Advantages of Pivot Lines TimeZone
Daily Trend Analysis: Visualizes highs, lows, and ranges of current and previous days
Pivot Levels & Midpoints: Displays traditional pivot points and Camarilla lines for better support/resistance identification
Customizable: Adjust settings to match your trading style and preferred timeframes
Integrates with Other Indicators: Works seamlessly with RSI, MACD, or other momentum tools to generate trade signals
Free to Download: Accessible for all MT4 traders
Trading Tips
Combine pivot levels with price action confirmation for higher probability trades.
Use longer timeframes to identify the primary trend, and lower timeframes for precise entry points.
Always consider previous day ranges as they can impact intraday price movement.
While the Pivot Lines TimeZone indicator does not provide direct BUY/SELL alerts, it forms the foundation of a reliable trend and pivot-based trading strategy.
Conclusion
The Pivot Lines TimeZone indicator for MT4 is an excellent tool for traders seeking to understand daily market trends and key pivot levels. By highlighting the highs, lows, open and close prices of the current and previous day, it provides a strong framework for identifying potential support and resistance zones.
When combined with momentum indicators such as RSI or MACD, the Pivot Lines TimeZone can also guide BUY/SELL signals, enhancing your trading strategy.
Download the Pivot Lines TimeZone indicator for free from IndicatorForest.com and take your trend analysis to the next level.
FAQ
Published:
Nov 13, 2025 22:57 PM
Category: