The Derivative Oscillator Indicator is a powerful tool that blends extended versions of the RSI and MACD to deliver highly accurate market analysis. Suitable for any financial instrument and timeframe, this indicator helps traders measure trend direction, market momentum, and potential reversals. Because it works seamlessly with Price Action, chart patterns, and other technical tools, the Derivative Oscillator is a favorite among traders who want enhanced clarity in market signals.
How the Derivative Oscillator Is Calculated
Understanding the components behind the indicator reveals why it performs so well. The Derivative Oscillator is derived through a multi-step process:
Double-Smoothed RSI
The RSI is smoothed twice to reduce noise and create a clearer momentum structure.
SMA of the Smoothed RSI
A simple moving average is applied to the double-smoothed RSI, providing a baseline for comparison.
MACD Component
The MACD is calculated using the difference between the 12-period EMA and the 26-period EMA, enhancing trend sensitivity.
By comparing the double-smoothed RSI against its moving average—while incorporating MACD dynamics—the Derivative Oscillator produces an improved and more accurate momentum signal.
How to Use the Derivative Oscillator
The indicator functions similarly to the MACD but with added sensitivity and clarity due to its RSI smoothing process.
Zero Line Crossovers
Cross above zero → BUY opportunity
Cross below zero → SELL opportunity
Positive readings indicate bullish momentum, while negative readings signal bearish conditions.
Using Slope Direction
The slope of the bars also provides critical information:
Slope turning upward (negative → positive): bullish trend forming
Slope turning downward (positive → negative): bearish
beginning
This helps traders anticipate trend changes earlier than with a standard oscillator.
Bar Length for Trend Strength
Long green bars → strong uptrend
Large red bars → strong downtrend
Short bars → weak or consolidating market
When the bars shrink near the zero line, momentum is fading. During these periods, traders should avoid entering positions.
Using Divergence With the Derivative Oscillator
Divergence is one of the most powerful signals the indicator offers:
Bearish divergence: price rises while the oscillator falls → possible market top
Bullish divergence: price falls while the oscillator rises → potential reversal upward
Divergence helps traders identify major turning points before they occur on the price chart.
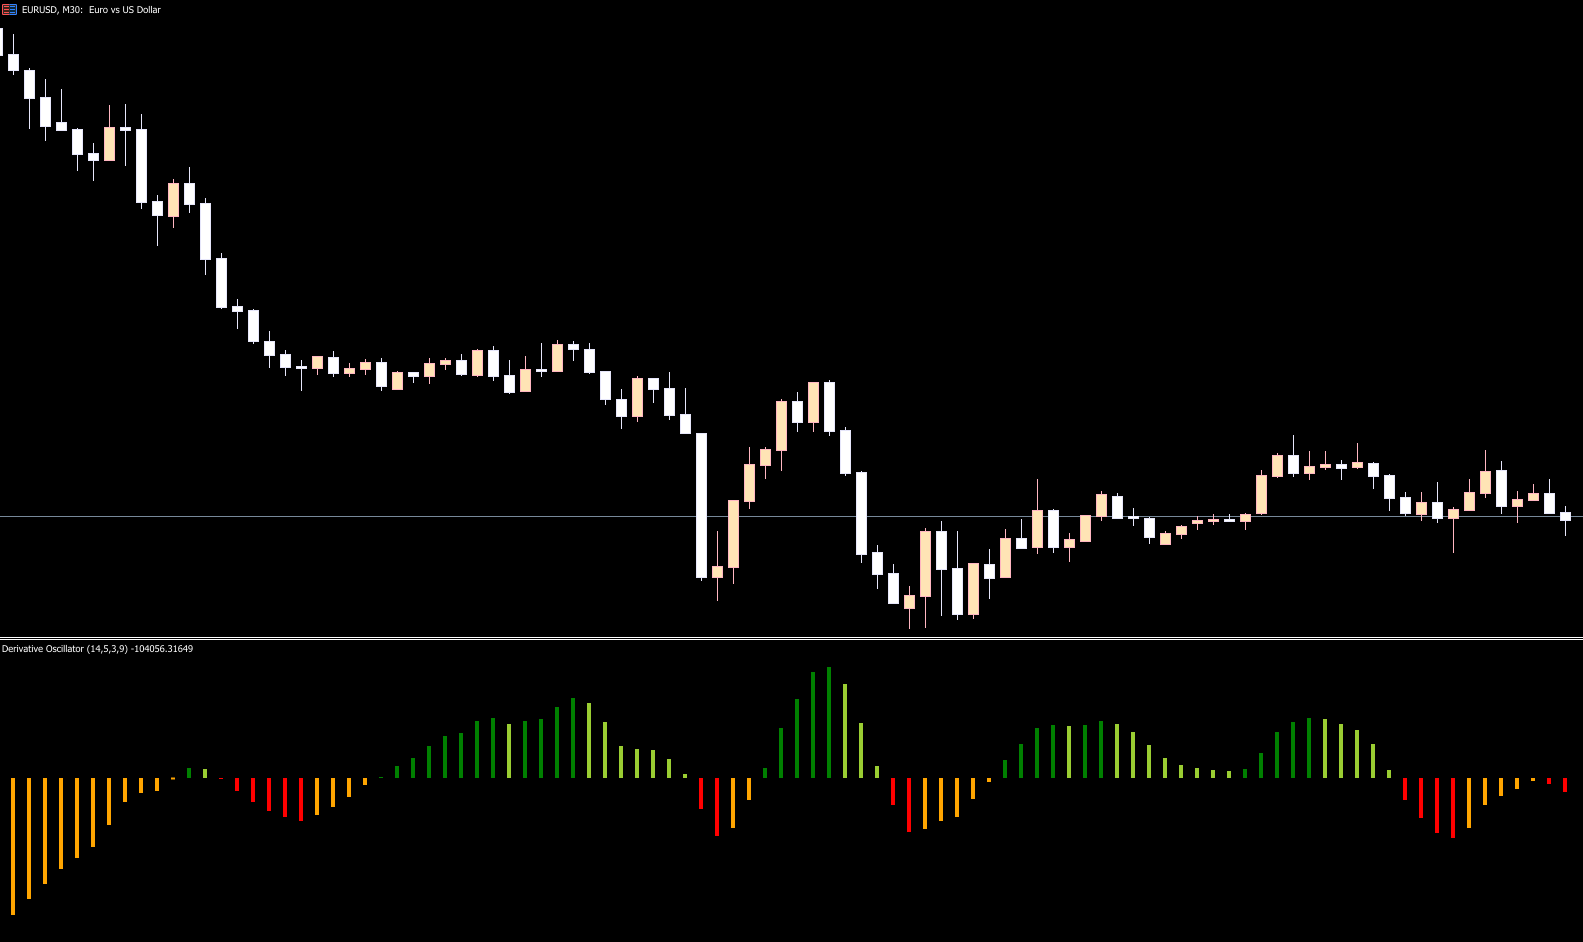
Example: Derivative Oscillator in Real Market Conditions
In a EUR/USD example:
Light green and orange bars show consolidation or weak momentum near the zero line
Large red bars signal sellers taking control and establishing a strong downtrend
Bars sloping downward confirm sustained bearish pressure
During an uptrend, green bars rise above zero, showing strong bullish momentum
Eventually, weakening bars and shrinking green momentum warn that the uptrend is losing strength. As soon as the indicator crosses back below zero, a bearish reversal may begin—providing an ideal sell opportunity.
Conclusion
The Derivative Oscillator Indicator offers a sophisticated blend of RSI smoothing and MACD logic, making it a versatile and accurate momentum tool. A BUY opportunity occurs when bars move above the zero line, while SELL signals appear when bars drop below zero. By watching slope direction, bar size, and divergence patterns, traders gain deep insight into trend strength and market behavior.
To explore more professional-grade indicators, visit IndicatorForest.com and enhance your technical trading toolkit.
FAQ
3 Downloads
Published:
Nov 15, 2025 00:49 AM
Category: