The Ichimoku Cloud MT5 indicator is one of the most complete trend-following tools available to Forex, stock, and crypto traders. Because the Ichimoku Cloud displays trend direction, momentum, support/resistance, and potential trade entries in one place, traders can make faster and more confident decisions. In this guide, you’ll learn how the Ichimoku Cloud works on MT5, how to identify buy/sell setups, and how to apply this legendary indicator using Goichi Hosoda’s Ichimoku Kinko Hyo strategy.
If you want access to more MT5 tools, templates, and upgraded indicators, make sure to visit IndicatorForest.com.
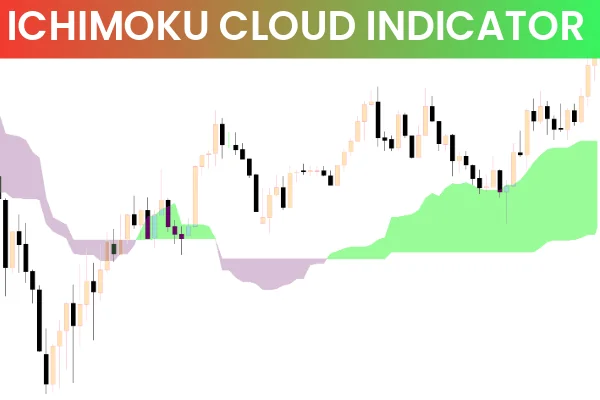
What Is the Ichimoku Cloud Indicator for MT5?
The Ichimoku Cloud, originally developed by journalist Goichi Hosoda in the 1960s, is a multi-functional indicator that combines several moving averages and projected price zones into a single chart. On MT5, it helps traders confirm market direction, identify pullbacks, and catch early trend reversals.
This indicator includes five main components:
Tenkan-sen (Conversion Line) – fast moving average
Kijun-sen (Base Line) – slow moving average
Senkou Span A – first cloud boundary
Senkou Span B – second cloud boundary
Chikou Span (Lagging Line) – momentum confirmation
Together, these lines form the well-known “Kumo” or cloud, which visually highlights market conditions and price behavior.
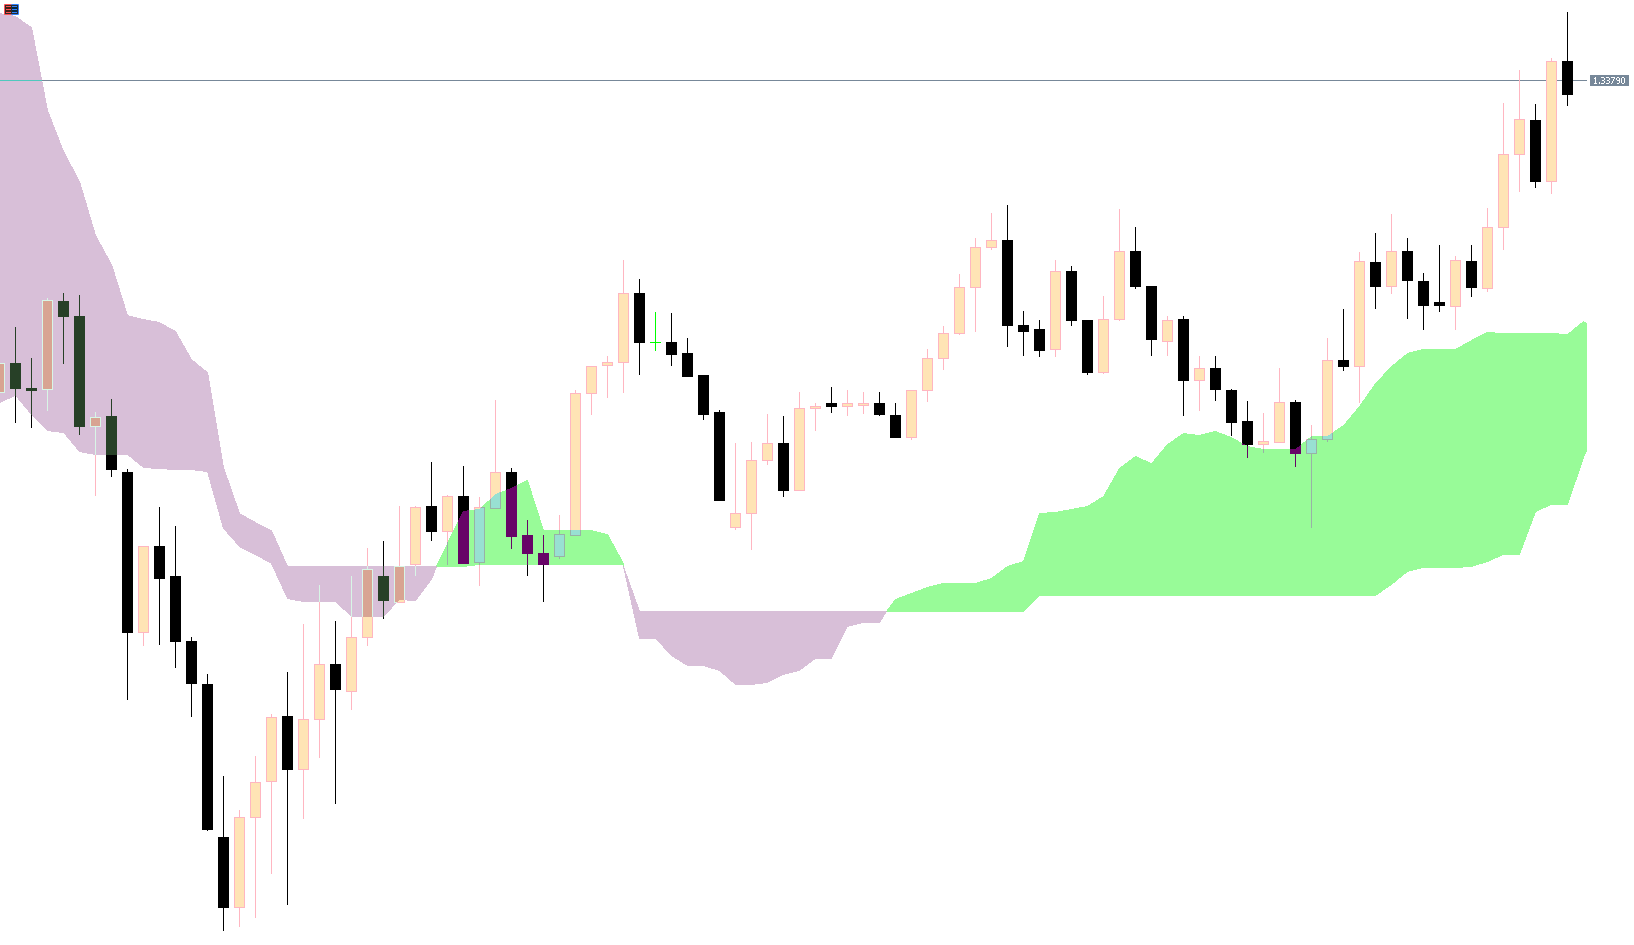
How Ichimoku Cloud Reveals Trend Direction on MT5
Price Above, Inside, or Below the Cloud
One of the clearest features of Ichimoku Cloud MT5 is its trend-detection ability:
Above the Cloud – bullish trend; focus on buy entries
Inside the Cloud – neutral or uncertain zone; trade with caution
Below the Cloud – bearish trend; focus on sell entries
This quick visual scan helps traders avoid bad markets and stay aligned with the primary trend.
How to Determine Buy-Sell Setups Using Ichimoku Cloud MT5
The Ichimoku system is built around the interaction of Tenkan-sen and Kijun-sen. These two lines act like dynamic support/resistance and also provide early trend signals.
The Tenkan-Kijun Crossover
A bearish signal occurs when Tenkan-sen crosses below Kijun-sen.
A bullish signal occurs when Tenkan-sen crosses above Kijun-sen.
To filter out noise, traders combine the crossover with cloud direction:
A bearish crossover + price breaking below the cloud confirms a sell setup.
A bullish crossover + price pushing above the cloud confirms a buy setup.
Ichimoku Checklist for MT5 Traders
Use this checklist before entering any trade:
Where Is Price Relative to the Cloud?
Above the cloud → buy bias
In the cloud → wait or trade small
Below the cloud → sell bias
Is the Market Trending Clearly?
Ichimoku works best in clear trending markets.
If price whips back and forth across the cloud, avoid trading or switch to another strategy.
Where Should You Place Your Stop-Loss?
Two common Ichimoku stop placement methods:
Using the cloud as a dynamic stop zone
Using the Kijun-sen (Base Line) as a logical stop level
Final Thoughts on Trading with Ichimoku Cloud MT5
The Ichimoku Cloud MT5 indicator remains one of the most complete market-analysis tools ever invented. It provides early trend signals, strong confirmation, and highly visual Market Structure. Although beginners may find it complex at first, practice on a demo account makes the system easier to master.
For more MT5 indicators, trading tools, and tutorials, visit IndicatorForest.com.
FAQ
3 Downloads
Published:
Nov 19, 2025 23:25 PM
Category: