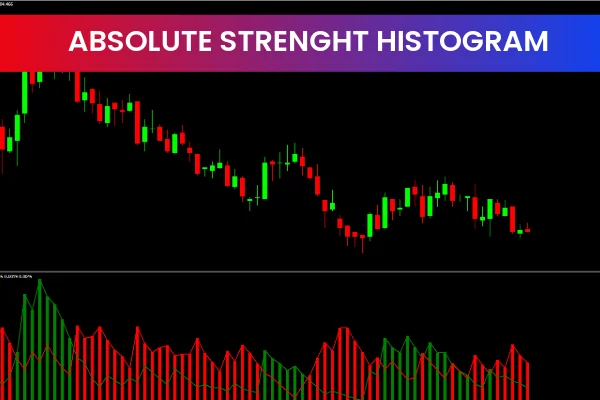
The EURUSD H1 chart above highlights how the Histogram Zero Line cross signal works. Compared to arrow signals, the zero-line cross delivers more stable and reliable long-term trading signals, making it ideal for trend-following strategies.
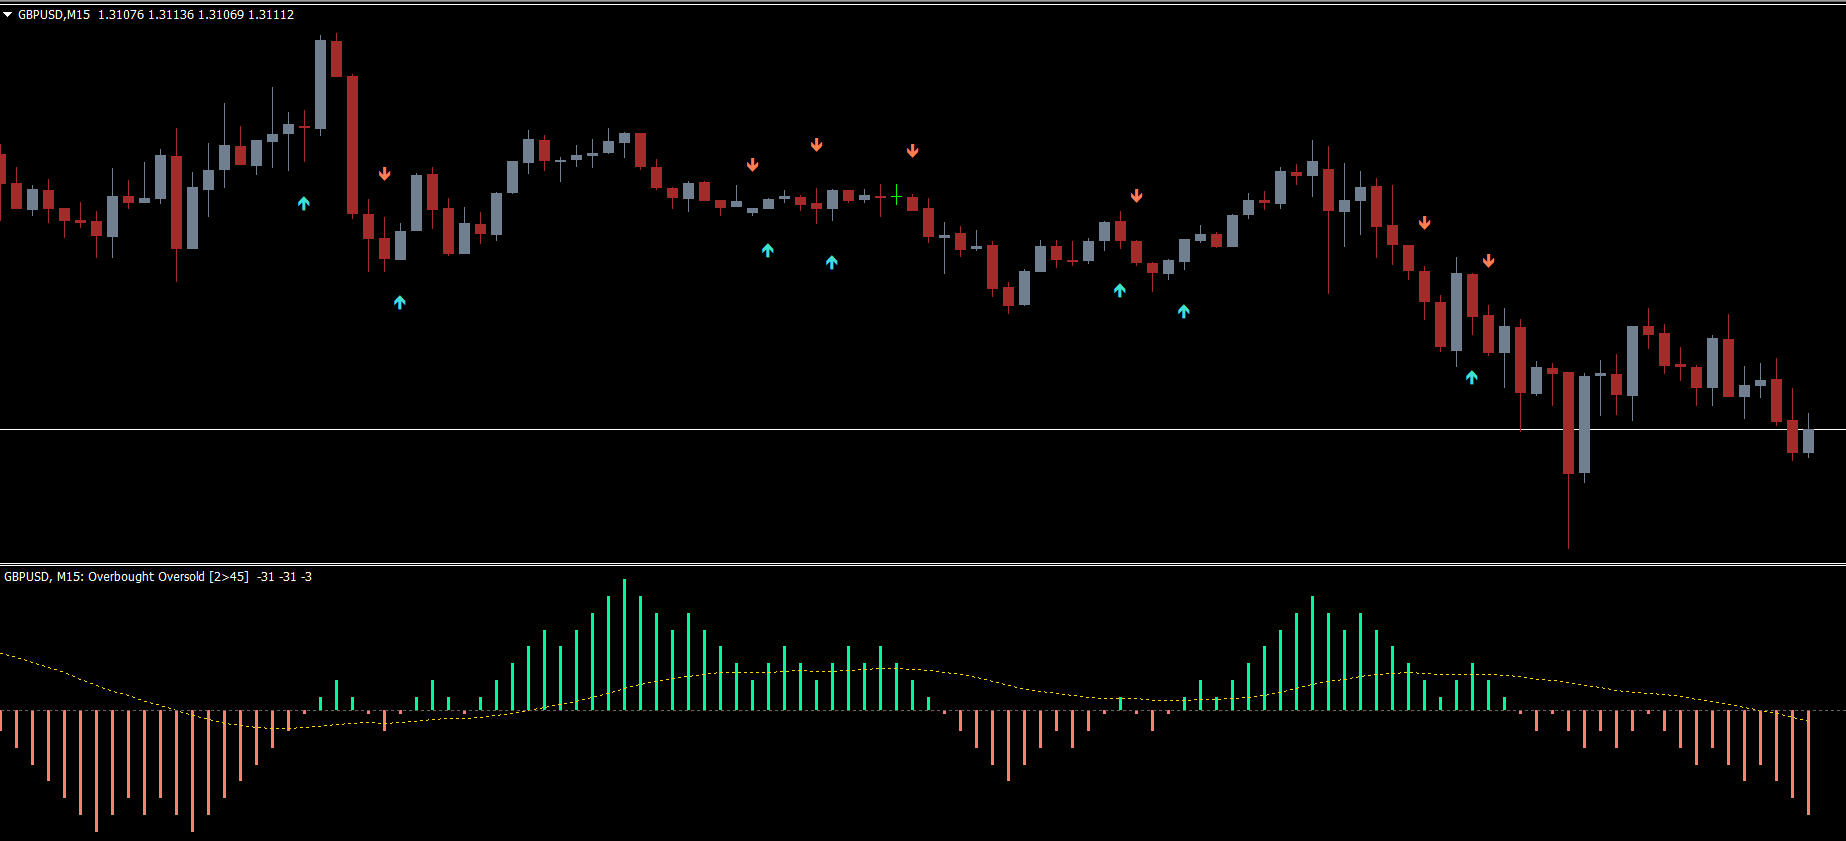
Buy Signal
Traders can enter a BUY position when:
The histogram turns GREEN
The histogram is above the ZERO line
A logical stop-loss should be placed below the previous swing low to protect the setup.
For trade management, it is often best to hold the position and ride the trend until:
The histogram switches to the opposite color, or
The histogram falls back below the Zero line
Both conditions signal a weakening bullish momentum.
Sell Signal
A SELL setup appears when:
The histogram turns RED
The histogram is below the ZERO line
The recommended stop-loss should be set above the previous swing high.
Profits should be taken when:
The histogram changes to the opposite color, or
The histogram rises above the Zero line
This shift indicates that bearish pressure is fading.
Conclusion
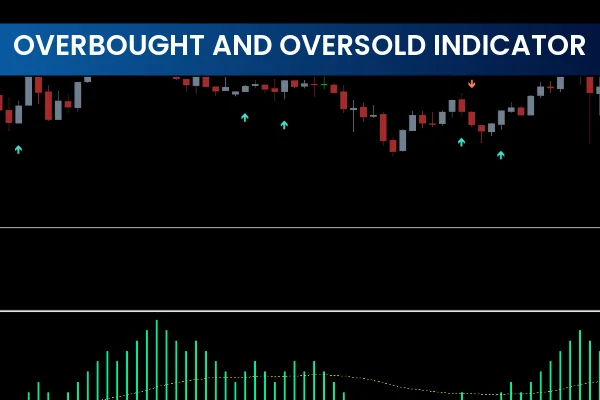
The Overbought and Oversold Indicator for MT4 is a versatile tool that provides multiple types of signals, including histogram color changes, zero-line crosses, and dynamic trend cues. It is fully customizable, easy to use, and free to download—making it suitable for both beginner and advanced technical traders.
FAQ
2 Downloads
Published:
Nov 19, 2025 09:39 AM
Category: