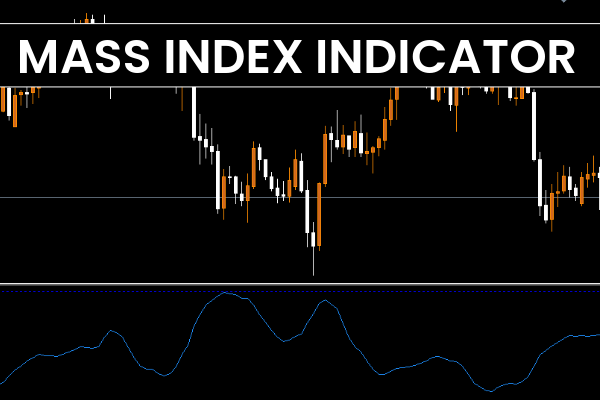
The Mass Index Indicator was developed to analyze volatility and momentum rather than price direction. Unlike oscillators or moving averages that measure overbought or oversold conditions, the Mass Index focuses on changes in price ranges to detect when a trend is likely to reverse.
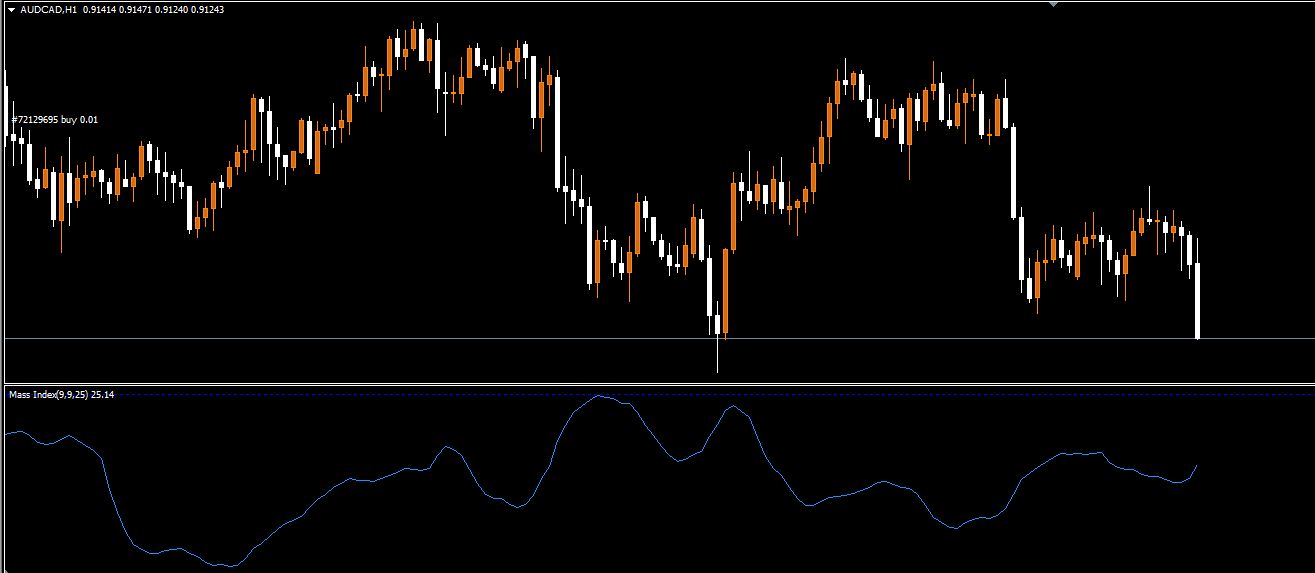
On the MetaTrader 4 platform, the indicator measures the expansion and contraction of price ranges. A phenomenon known as a “reversal bulge” occurs when the indicator rises above the 27 level and then drops below 26.5. This specific pattern signals a potential change in trend direction — either from bullish to bearish or vice versa.
Traders can then look for confirmation from candlestick patterns or other indicators to enter long or short trades based on this reversal signal.
How to Use the Mass Index Indicator on MT4
The Mass Index Indicator works across all timeframes, but it is especially effective on higher timeframes such as the daily, weekly, or monthly charts. The indicator has two key reference levels:
27 level – Signals increasing volatility and potential exhaustion of the current trend.
26.5 level – When the indicator drops below this point after being above 27, a reversal bulge is confirmed.
Trading Strategy Using the Mass Index Indicator
To trade with the Mass Index, follow these steps:
Identify a Reversal Bulge
Watch for the indicator to rise above 27 and then fall below 26.5. This pattern indicates that the previous trend might be coming to an end.
Confirm with Candlestick Patterns
Look for reversal candlestick formations such as bullish engulfing, bearish engulfing, pin bars, or doji patterns to confirm a new trend direction.
Enter a Trade
Buy Setup: When the indicator signals a reversal bulge during a downtrend and a bullish reversal pattern appears.
Sell Setup: When a reversal bulge forms during an uptrend and a bearish candlestick confirms the shift.
Place Stop Loss and Manage the Trade
For a sell trade, place a stop loss above the recent swing high or above the high of the reversal candle.
For a buy trade, place a stop loss below the recent swing low.
Use a trailing stop to lock in profits as the new trend develops.
Example: Using the Mass Index on the USD/JPY Chart
In the example below (USD/JPY H4 chart), the market shows a bullish trend from November 6 to November 9, 2020, while the Mass Index rises above 27 (marked with a blue vertical line).
On November 10, 2020, the indicator drops below 26.5 (red vertical line), forming a reversal bulge. Shortly after, a bearish engulfing candle appears — confirming the end of the bullish trend and signaling a SELL opportunity.
A stop loss is placed slightly above the previous swing high, and a trailing stop is used to follow the newly formed downtrend. This simple yet powerful setup captures the early momentum of the reversal, maximizing profit potential while managing risk.
Best Practices for the Mass Index Indicator
Best Timeframes: Daily, Weekly, and Monthly for higher accuracy.
Combine with Other Tools: Use alongside Moving Average crossovers, MACD, or Price Action analysis for better confirmation.
Avoid Noise: On smaller timeframes, false signals may occur due to market fluctuations — stick to higher timeframes for cleaner results.
Use Candlestick Confirmation: The indicator identifies potential reversals, but confirmation via price action greatly improves success rates.
Conclusion
The Mass Index Indicator for MT4 is one of the most effective tools for identifying trend reversals before they fully form. By analyzing price range expansions and contractions, it provides traders with early alerts of potential turning points in the market.
Although it can be used as a standalone tool, the Mass Index performs best when combined with candlestick patterns, moving averages, or MACD. Its simplicity and effectiveness make it suitable for both beginner and professional forex traders who aim to trade trend reversals with confidence and precision.
👉 Download the Mass Index Indicator for MT4 today and start identifying reversal opportunities with accuracy and ease.
FAQ
2 Downloads
Published:
Nov 07, 2025 08:36 AM
Category: