The TradeTime v2 Indicator for MT4 is a simple yet effective trading tool designed to identify trend direction based on specific time periods. This indicator automatically plots rectangular boxes on the chart to highlight when a new trend starts and when it begins to fade.
Unlike many complex trend indicators, TradeTime v2 focuses on time-based analysis, making it ideal for traders who prefer a clean, visual approach to identifying buy and sell opportunities.
How the TradeTime v2 Indicator Works
The TradeTime v2 Indicator plots boxes on candlesticks according to the selected timeframe. Traders can choose any timeframe, but it performs best on higher timeframes such as H4, Daily, and Weekly charts.
When a strong trend begins, the indicator draws a box over the starting candles to show where momentum has shifted.
As the trend loses strength or ends, a new box appears, signaling a potential change in direction.
This visual representation makes it easier to spot the beginning and end of strong trends without manually analyzing every candle.
How to Trade Using the TradeTime v2 Indicator
The indicator provides straightforward buy and sell signals based on where it plots the boxes.
Buy Signal
When the indicator plots a box at the start of a bullish candle, it signals that a new uptrend may be starting.
Traders can open a long position when this occurs and hold until a new box appears in the opposite direction.
💡 Example: On a GBP/USD H4 chart, if the indicator draws a green or blue box during an upward candle, it suggests strong bullish momentum.
Sell Signal
When a bearish candle forms and the indicator plots a box around it, this indicates the start of a downtrend.
Traders can open a short position when this box appears and stay in the trade until the next reversal box forms.
💡 Example: A red or orange box appearing during a bearish candle signals potential selling pressure and a shift to a bearish market phase.
Combining with Other Indicators
While TradeTime v2 can be used independently, combining it with other tools can improve accuracy and reduce false signals.
RSI (Relative Strength Index) – Confirms whether the market is overbought or oversold before entering trades.
MACD – Verifies Trend Strength and momentum to align trades with larger market movements.
By combining these confirmations, traders can filter out weak signals and trade with greater confidence.
Why Use the TradeTime v2 Indicator?
Time-based trend identification – Detects trend start and end points automatically.
Simple and beginner-friendly – Ideal for traders who prefer visual signals.
Best for higher timeframes – Works accurately on H4, Daily, and Weekly charts.
Customizable – Easily adjust settings to match your trading strategy.
Compatible with other indicators – Works well with RSI, MACD, and Moving Averages.
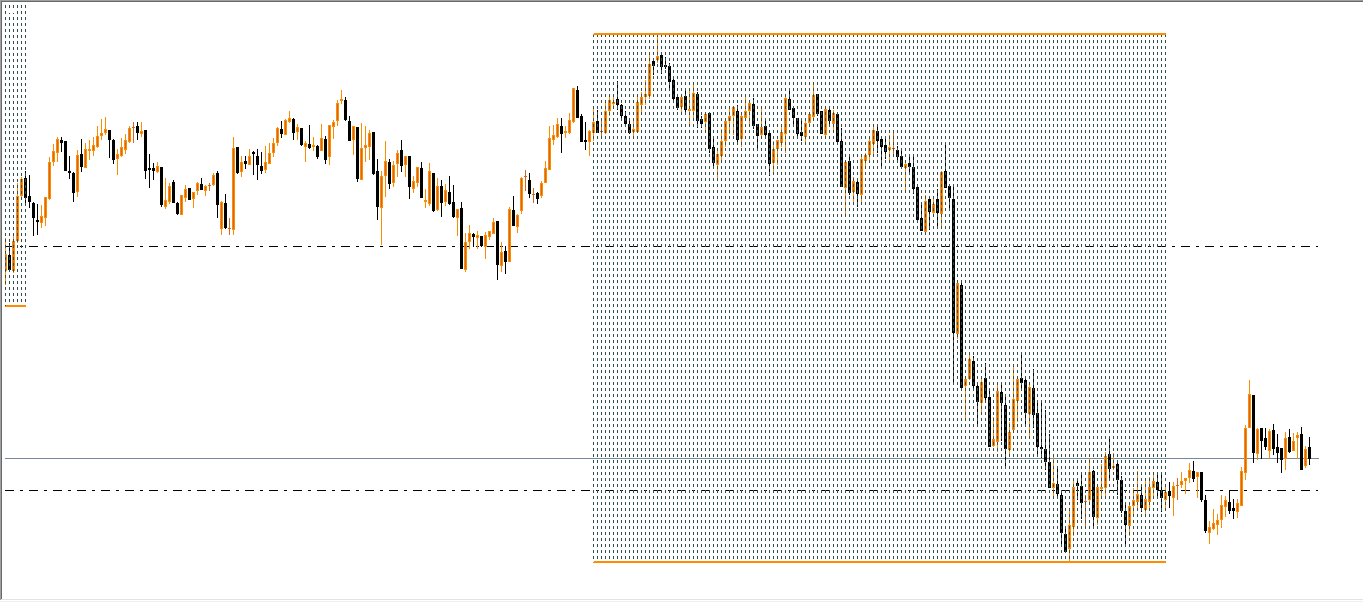
Example: GBP/USD H4 Chart
On the GBP/USD H4 chart, the TradeTime v2 Indicator clearly shows Buy and Sell signals. When a new box forms on a bullish candle, it indicates the beginning of an uptrend, confirming a buy opportunity.
Similarly, when the indicator plots a box on a bearish candle, it signals the start of a downtrend, providing a clear sell opportunity.
This makes it a powerful tool for both trend-following and swing trading strategies.
Conclusion
The TradeTime v2 Indicator for MT4 is a simple yet powerful time-based Trend Indicator that helps traders identify when trends begin and end. It’s ideal for higher timeframes and provides clear Buy and Sell signals through colored boxes plotted on price charts.
Whether you’re a beginner or an experienced trader, the TradeTime v2 Indicator can help simplify your trend analysis and improve your trading performance.
You can download the TradeTime v2 Indicator for free from our website and start using it to trade Forex, stocks, or commodities with confidence.
FAQ
1 Download
Published:
Nov 09, 2025 13:19 PM
Category: