The Turtle Channel Indicator is a powerful trend-following system for MetaTrader 4 (MT4) that uses historical price highs and lows to form dynamic breakout channels. Built on the principle that past highs and lows act as future Support And Resistance zones, the indicator helps traders identify Market Structure, trend direction, reversal points, and potential breakout opportunities.
By plotting colored channel lines, the Turtle Channel Indicator makes it easy for scalpers, day traders, and swing traders to follow Price Action and improve timing for entries and exits. Whether you're a beginner or an advanced trader, this indicator adds clarity and precision to your technical analysis.
How the Turtle Channel Indicator Works
Trend Channels Based on Previous Highs and Lows
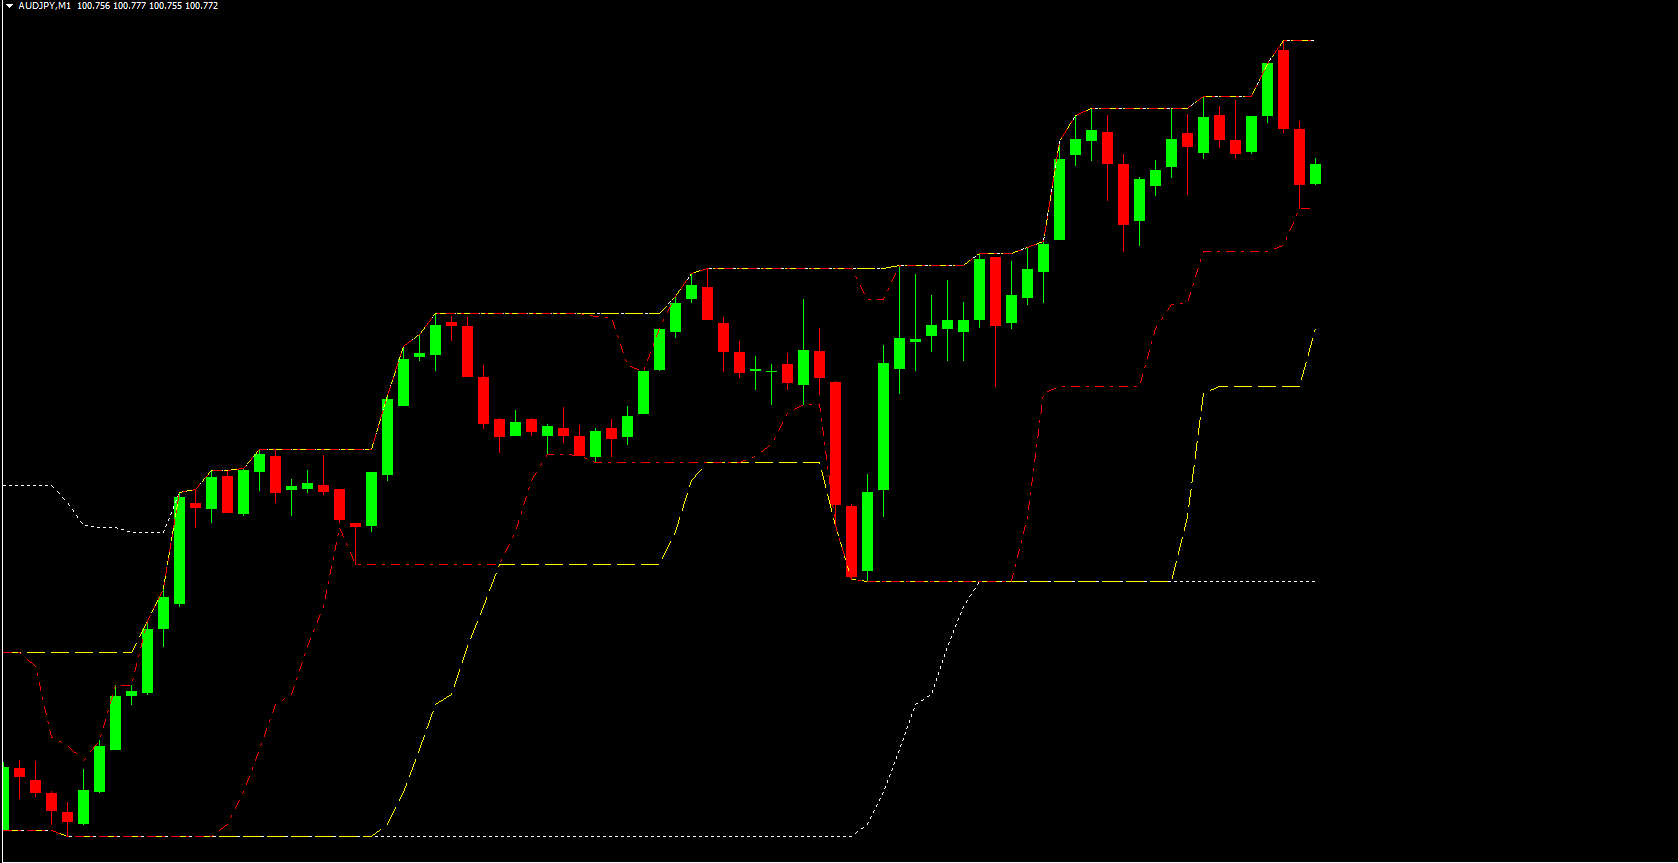
The indicator forms a channel based on:
Red Line – upper breakout level
Yellow Line – lower breakout level
White Line – optimal trade exit or mid-channel zone
These lines update dynamically as new price highs and lows are formed, giving traders a real-time view of Trend Strength and potential reversal zones.
Support and Resistance Behavior
Because historical highs often turn into resistance and historical lows turn into support, the Turtle Channel Indicator provides a reliable framework for predicting market reactions at key levels.
How to Use the Turtle Channel Indicator
Entry Signals
Traders typically look for buy or sell signals when the red and yellow lines align at the upper or lower channel. However, not every channel touch is a valid trade. It is essential to combine the indicator with:
Price action patterns
Trend confirmation indicators
Candlestick confirmation
Momentum tools (RSI, MACD, Stochastics)
This synergy increases accuracy and reduces false entries.
Trading the Turtle Channel Indicator: Practical Example
Consider the EURUSD pair on the M15 timeframe. The indicator provides multiple high-probability trade setups once price interacts with the channel lines.
Bullish Scenario (Buy Setup)
Price forms a bullish engulfing candlestick pattern on the lower channel (yellow line). This indicates strong buying pressure and potential Trend Continuation or reversal to the upside.
Bearish Scenario (Sell Setup)
Later, price forms a bearish engulfing pattern on the upper channel (red line). This signals potential weakness and a possible reversal downward.
These examples show the importance of price action confluence when using the Turtle Channel Indicator. The most reliable setups occur when channel interaction is supported by strong candlestick signals.
Advantages of the Turtle Channel Indicator
Excellent for identifying trend reversals
Works on all timeframes
Ideal for scalpers, intraday traders, and swing traders
Suitable for beginners, intermediate, and advanced traders
Helps identify breakout levels and exit points
Simple and visual representation of trend behavior
Conclusion
The Turtle Channel Indicator for MT4 is a reliable tool for trend-following and reversal trading strategies. By basing its channel on past highs and lows, it provides accurate forecasting of support, resistance, and breakout zones. Traders who combine the indicator with price action gain a significant advantage in spotting profitable setups.
To download more forex tools and explore hundreds of premium trading indicators, visit IndicatorForest.com.
FAQ
6 Downloads
Published:
Nov 14, 2025 10:13 AM
Category: