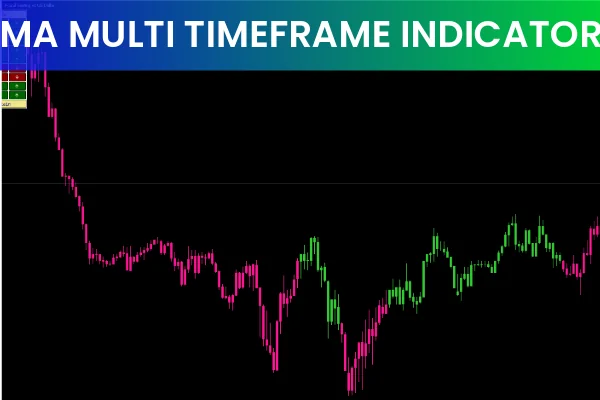
The MA Multi Timeframe Indicator is one of the most effective MT4 tools for traders who depend on moving averages to study market trends. The moving average is a classic and widely-used statistical indicator in both forex and stock trading. However, analyzing multiple timeframes manually can be stressful, time-consuming, and prone to human error.
With the MA Multi Timeframe Indicator, traders can view moving averages from several timeframes in a single window. This saves time and provides an instant overview of long-term and short-term trend direction. Whether you trade intraday, swing, or long-term strategies, this indicator adds clarity and efficiency to your market analysis.
How the MA Multi Timeframe Indicator Works
The indicator displays the direction of moving averages across different timeframes using green and red arrows:
Green arrow – price is above the moving average (bullish trend)
Red arrow – price is below the moving average (bearish trend)
When all arrows turn green, the market shows strong bullish momentum.
When all arrows turn red, it signals a strong bearish trend.
Mixed arrows indicate market consolidation or transitional price behavior.
For example, on the GBPUSD chart, if the price stays above the 25-period moving average on all monitored timeframes, the indicator will display a full set of green arrows—confirming a solid uptrend.
Additionally, you can customize the moving average period for each timeframe, allowing you to match the indicator with your personal strategy, whether trend-following, breakout, or reversal-based.
Trading Strategy Using the MA Multi Timeframe Indicator
Buy Strategy
Set the moving average period to 20 across timeframes.
Wait until all arrows turn green, indicating a strong uptrend.
Move to the M30 chart and wait for a bullish candle to complete.
Place a buy order at the market price.
Set your stop loss below the recent swing low.
Set take profit at the next resistance level or psychological round number.
Sell Strategy
Set the moving average period to 20 across timeframes.
Look for all red arrows, signaling a clear downtrend.
Confirm with a bearish candle closure on the M30 chart.
Enter a sell trade at the market price.
Place stop loss above the recent swing high.
Target the next support level or round-number zone for your take profit.
Using multi-timeframe alignment helps filter noise and improves the probability of successful entries.
MA Multi Timeframe Indicator – Conclusion
The MA Multi Timeframe Indicator offers a powerful way to evaluate trend strength without wasting time switching between charts. It delivers quick visual confirmation of trend direction across multiple timeframes, allowing traders to make faster and more informed decisions.
However, it should not be used alone. For best results, combine this MT4 indicator with additional tools such as price action, Support And Resistance, or oscillators.
To download more advanced MT4 and MT5 tools, visit IndicatorForest.com and upgrade your trading strategy today.
FAQ
3 Downloads
Published:
Nov 19, 2025 01:56 AM
Category: