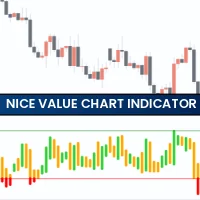
The Nice Value Chart Indicator is a technical oscillator designed to automatically detect overbought and oversold zones.
Compared to other oscillators, the Nice Value Chart Indicator has one distinctive feature – it is extremely pleasant to look at.

How do I add the Nice Value Chart Indicator to the main chart in MT4?
First, download the free file “Nice Value Chart 1.0.ex4” from our website. Then paste it into MetaTrader 4 by following these instructions.
To add the indicator to the chart, you can use one of two methods:
Drag and drop the indicator from the Navigator window onto the open price chart
Or select Insert → Indicators → Custom → Nice Value Chart from the main menu
After adding the indicator, you will see below the price area:
Four-color vertical bars calculated from price dynamics
Two horizontal lines representing overbought and oversold boundaries
How to Use the Nice Value Chart for Trading
The Nice Value Chart Indicator values typically fluctuate around zero.
When the value rises above the overbought line, the bar turns green, signaling a possible sell opportunity, assuming the price is too high and may reverse downward.
When the value falls below the oversold line, the bar turns red, signaling a possible buy opportunity, assuming the price is too low and may reverse upward.
How Accurate Are the Base Signals?
Like all oscillators, the Nice Value Chart Indicator also has limitations:
A sell signal may appear when the market is actually entering a bullish trend, leading to losses.
A buy signal may appear when the market is entering a bearish trend, again causing potential losses.
To reduce false signals, it is recommended to confirm entries using:
Chart patterns
Trend indicators
Additional oscillators
Using multiple confluences increases the probability of profitable trades.
Nice Value Chart Sell Signals Example
In the GBPUSD H1 chart example, a valid sell signal occurs when:
The market is in a bearish trend
The oscillator enters the overbought zone
Price aligns with a significant resistance area
Nice Value Chart Buy Signals Example
In the AUDUSD Daily chart example:
The oscillator enters the oversold zone
Price forms a bullish reaction
A long entry may be refined by switching to a lower timeframe
A stop-loss can be placed below the candle that generated the oversold reading.
You may exit with profit using:
Counter-signals near resistance
A trailing stop
A fixed take-profit level
Additional Signal: Divergence
Divergence is another powerful method when using the Nice Value Chart Indicator.
For example, in the USDJPY M5 chart:
Price creates lower lows
The indicator creates higher lows
This bullish divergence signals that bearish momentum is weakening and a Trend Reversal may be near.
Conclusion
The Nice Value Chart Indicator for MetaTrader helps traders buy near the lows and sell near the highs. It automatically identifies overbought and oversold conditions and works across all markets: forex, stocks, and more.
Advantages
Customizable alerts
Non-repaint
High-quality design
Simple settings
Automatic buy/sell notifications
Suitable for intraday and long-term charts
Works across all instruments
Disadvantages
Does not include arrow signals
Calculation formula is not publicly known
Base signals alone can be weak
Recommendation
Improve reliability by:
Taking buy signals only in bullish trends
Taking sell signals only in bearish trends
Combining with trendlines, S/R, or other indicators
Download the Nice Value Chart Indicator for MT4 for Free Now!
FAQ
1 Download
Published:
Nov 17, 2025 21:42 PM
Category: