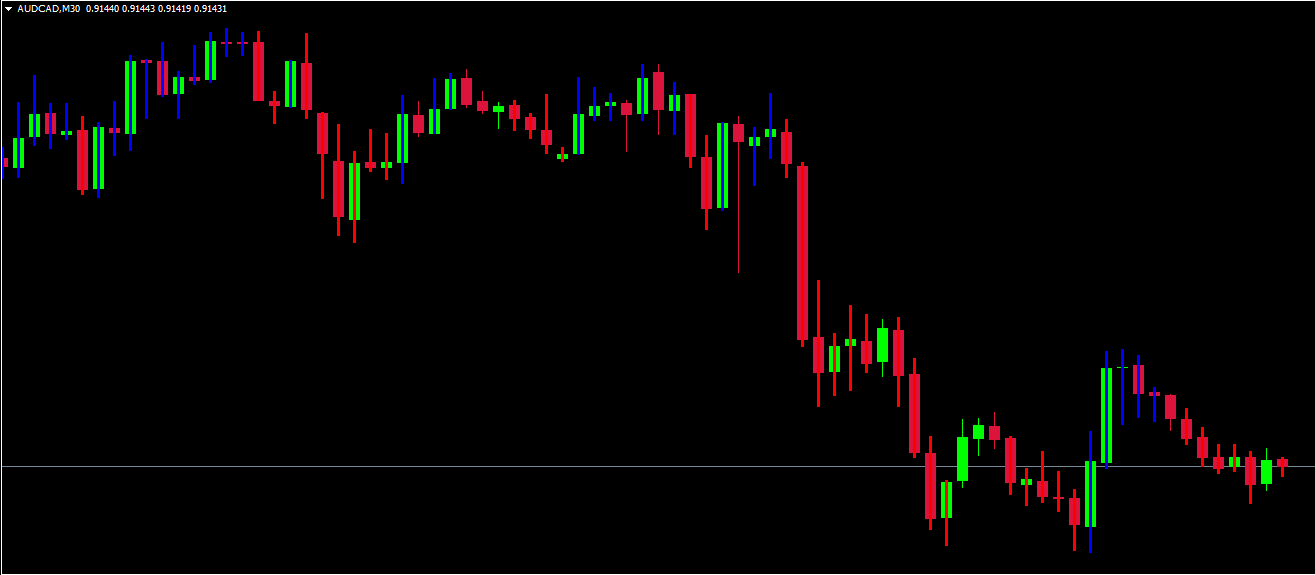
The TTM (Trade the Market) Indicator simplifies chart analysis by painting candlesticks red and blue according to market trends:
Blue Bars: Indicate an uptrend and signal potential buy opportunities.
Red Bars: Represent a downtrend and signal possible sell setups.
Unlike traditional candlestick charts that can be noisy and confusing during periods of indecision, the TTM indicator paints only strong trend candles—skipping weaker ones—to provide a clear, easy-to-follow market view.
The indicator is built using Heikin Ashi principles, where the candle’s Open, High, Low, and Close values are recalculated to reflect market averages. This results in smoother price transitions and better visualization of Trend Strength.
How the TTM Indicator Works
The TTM indicator applies a smoothing algorithm similar to the Heikin Ashi method, which modifies traditional candle data to reduce noise.
Heikin Ashi Formula (Simplified):
Open = (Previous Open + Previous Close) / 2
Close = (Open + High + Low + Close) / 4
High = Maximum of (High, Open, Close)
Low = Minimum of (Low, Open, Close)
By recalculating these values, the indicator identifies whether the trend is strong enough to display a colored bar. If not, the candle is skipped, highlighting only the dominant price moves.
This selective approach allows traders to focus on confirmed market momentum and filter out the sideways movement or market noise that often leads to false trades.
How to Trade Using the TTM Indicator
TTM Buy Strategy (Bullish Setup)
Look for blue bars forming on the chart — this indicates bullish momentum.
Wait for at least two consecutive blue bars to confirm a strong trend.
Enter a buy position after the second blue bar closes.
Place your stop-loss slightly below the recent swing low.
Exit the trade when a red bar appears, signaling a potential Trend Reversal.
Tip: For better accuracy, confirm your entry using a volume indicator — higher volume alongside blue bars typically signals stronger buying pressure.
TTM Sell Strategy (Bearish Setup)
Identify red bars forming on the chart — this shows bearish control.
Wait for two consecutive red bars to confirm trend strength.
Enter a sell position after the second red bar closes.
Set your stop-loss just above the recent swing high.
Exit the trade when a blue bar appears, indicating a possible bullish reversal.
Tips for Using the TTM Indicator Effectively Combine with Volume Indicators:
Since TTM highlights trend strength, pairing it with a Volume or OBV (On-Balance Volume) indicator enhances confirmation.
Use Multiple Timeframes: Higher timeframes (H1, H4, D1) produce more reliable signals, while lower ones are ideal for Scalping or intraday trading.
Avoid Neutral Periods: The indicator skips weak candles. Wait for consecutive colored bars to avoid entering during consolidation.
Pair with Support/Resistance: Use key Support And Resistance levels to validate TTM trend signals for higher accuracy.
Advantages of the TTM Indicator for MT4
Removes Market Noise – Focuses only on strong trends, reducing confusion from choppy Price Action.
Color-Coded Simplicity – Blue for uptrend, red for downtrend; perfect for quick visual analysis.
Trend Clarity – Highlights trend continuation and reversal zones clearly.
Versatile Usage – Works on all timeframes and assets (forex, indices, commodities, etc.).
Beginner-Friendly – No complex parameters; easy to interpret.
Conclusion
The TTM Indicator for MT4 is a powerful and user-friendly tool that helps traders cut through market noise and focus on strong, reliable trends. Using Heikin Ashi logic, it smooths out price fluctuations, offering a clear visual representation of market momentum.
Whether you’re a scalper, day trader, or swing trader, the TTM indicator can enhance your market timing and improve your trade consistency. For even better results, combine it with volume-based indicators or trend confirmation tools to validate entry and exit points.
You can download the TTM Indicator for MT4 for free from IndicatorForest.com and start using it to simplify your trend trading today.
Published:
Nov 04, 2025 15:49 PM
Category: