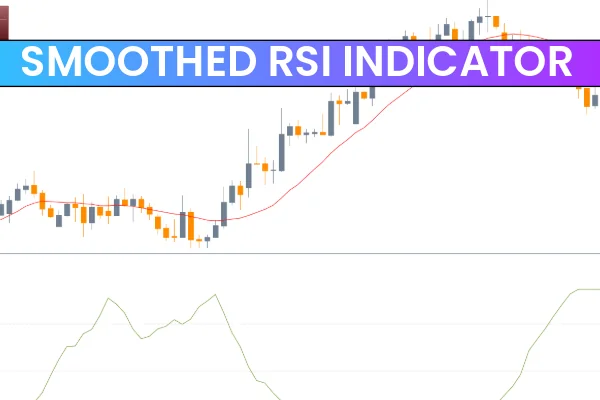
The Smoothed RSI Indicator for MT5 is a versatile trading tool that enhances the classic Relative Strength Index (RSI) by smoothing out noisy signals, making it easier for traders to identify overbought and oversold conditions. This indicator is particularly useful for both beginners and experienced Forex traders, offering multi-timeframe analysis (MTF) and divergence alerts to create more informed trading strategies.
Unlike the standard RSI, the Smoothed RSI minimizes sudden spikes and whipsaws, allowing traders to trade with greater confidence while avoiding false signals. By displaying RSI values from higher timeframes on the current chart, the indicator supports a top-down technical analysis approach, enabling traders to align entries with long-term trends.
How the Smoothed RSI Indicator Works
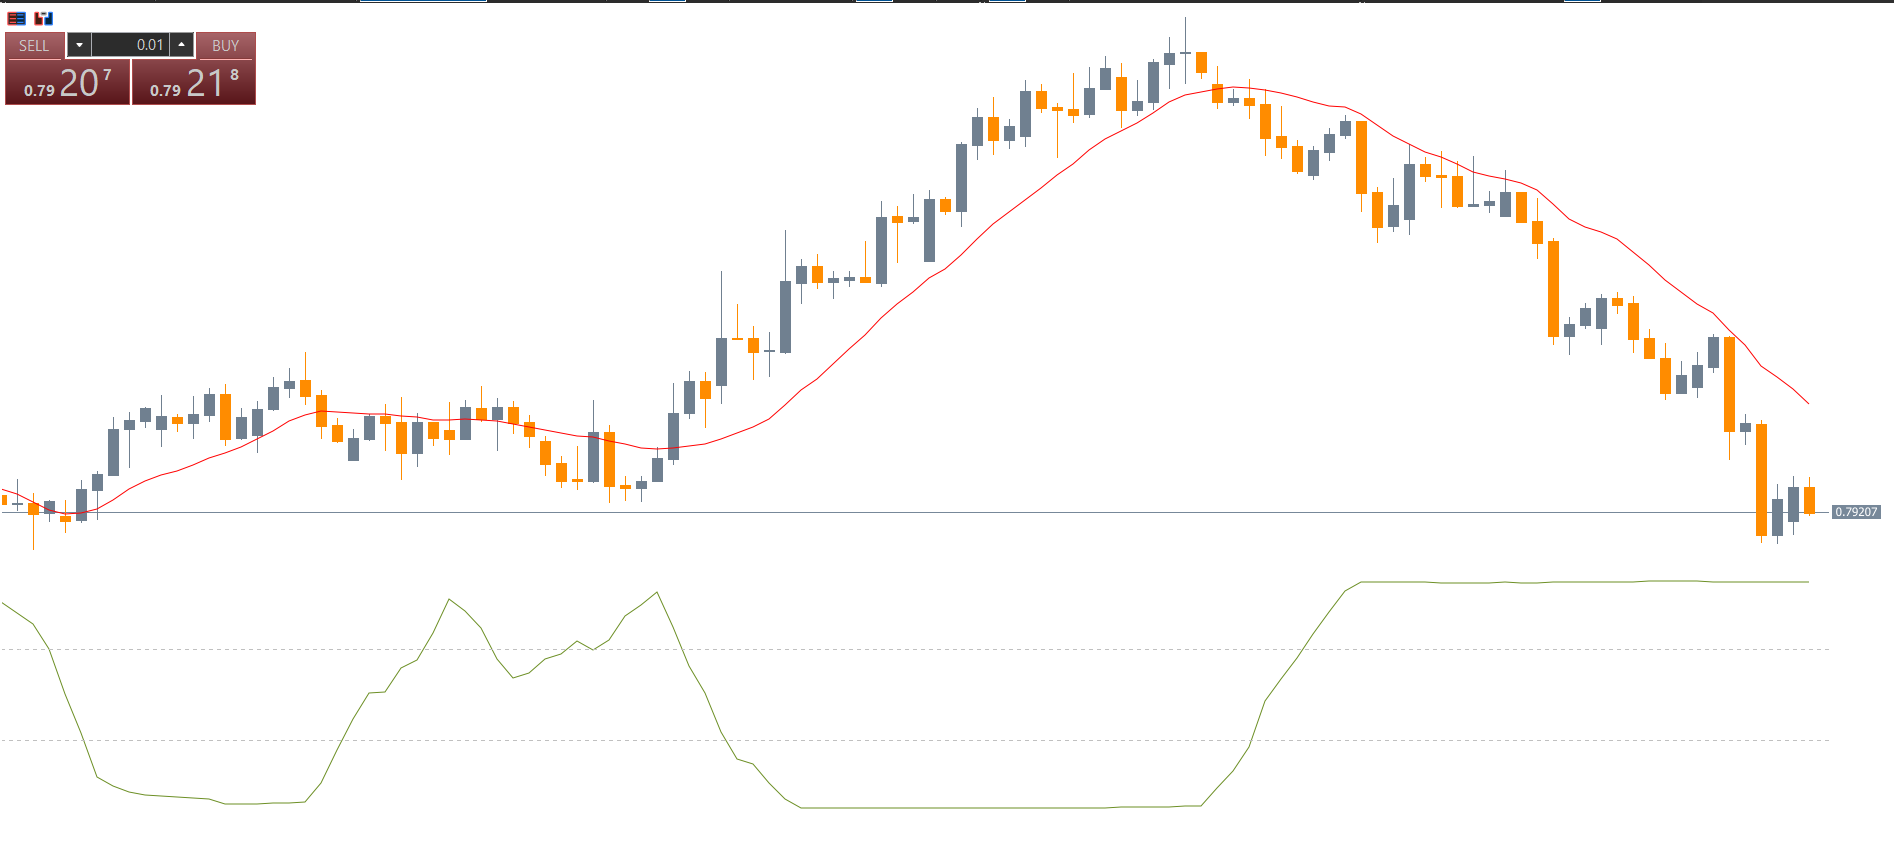
The indicator operates in a separate window below the price chart, displaying the following:
Overbought Zone: Typically above the 70 level, indicating a potential price reversal or correction.
Oversold Zone: Below the 30 level, signaling a possible bullish move.
Neutral Zone: Values between 30 and 70 displayed in dim gray, representing balanced market conditions.
Traders can customize the timeframe of the RSI calculation to view higher timeframe signals directly on the current chart. This multi-timeframe visualization allows traders to spot strong trends and confluence zones without switching charts constantly.
Trading Signals with Smoothed RSI
The Smoothed RSI provides multiple actionable signals for traders:
Overbought/Oversold Signals
Buy Signal: When the RSI rises above the oversold level (30), it indicates a potential bullish trend. Traders may enter long positions with a stop loss below the previous swing low.
Sell Signal: When the RSI reverses from overbought levels (70), it signals a potential bearish trend. Stop losses are placed above the recent swing high.
Divergence Trading
Bullish Divergence: Occurs when price forms lower lows while RSI forms higher lows, signaling an upcoming uptrend.
Bearish Divergence: Happens when price makes higher highs but RSI shows lower highs, suggesting a potential downtrend.
Divergence trading is a powerful method for anticipating trend reversals and aligning trades with market momentum.
Multi-Timeframe Analysis
The Smoothed RSI allows traders to monitor multiple RSI values from higher timeframes on a single chart. This ensures that short-term trades align with long-term trends, enhancing the probability of success.
Benefits of Using Smoothed RSI for MT5
Reduces Market Noise: Smooths out erratic RSI movements for clearer signals.
Supports Multi-Timeframe Analysis: Helps traders align entries with higher timeframe trends.
Alerts for Overbought/Oversold Conditions: Ensures timely notifications for potential trades.
Divergence Detection: Assists in identifying trend reversals before price reacts.
User-Friendly: Suitable for both beginner and advanced traders.
Flexible Trading Style: Works well for Scalping, day trading, and swing trading.
Conclusion
The Smoothed RSI Indicator for MT5 is a must-have tool for Forex traders seeking clear and reliable overbought/oversold signals. By combining multi-timeframe analysis, divergence alerts, and smoother RSI readings, it enhances both trend-following and reversal strategies. Whether you are a novice learning top-down technical analysis or an advanced trader refining your strategies, the Smoothed RSI provides actionable insights directly on your MT5 charts.
Download the Smoothed RSI MT5 indicator for free from IndicatorForest.com and start trading with smoother, more reliable signals today.
FAQ
Published:
Nov 13, 2025 23:10 PM
Category: