Master Intraday Structure with the DR IDR Candles Indicator for MT4
In the world of high-probability day trading, the "Defining Range" (DR) and "Implied Defining Range" (IDR) have become essential concepts for traders seeking to understand institutional order flow. The DR IDR Candles Indicator for MetaTrader 4 (MT4) is a professional structural tool that automates the identification of these critical price boundaries. By focusing on the first hour of market volatility, this indicator helps you determine the "bias" for the rest of the day, allowing you to avoid market noise and trade with the direction of the "smart money."
Understanding the DR and IDR Framework
The core philosophy behind the DR IDR indicator is that the first hour of a major trading session often sets the high and low for a significant portion of the day. Once these levels are established, they act as powerful magnets or barriers for Price Action.
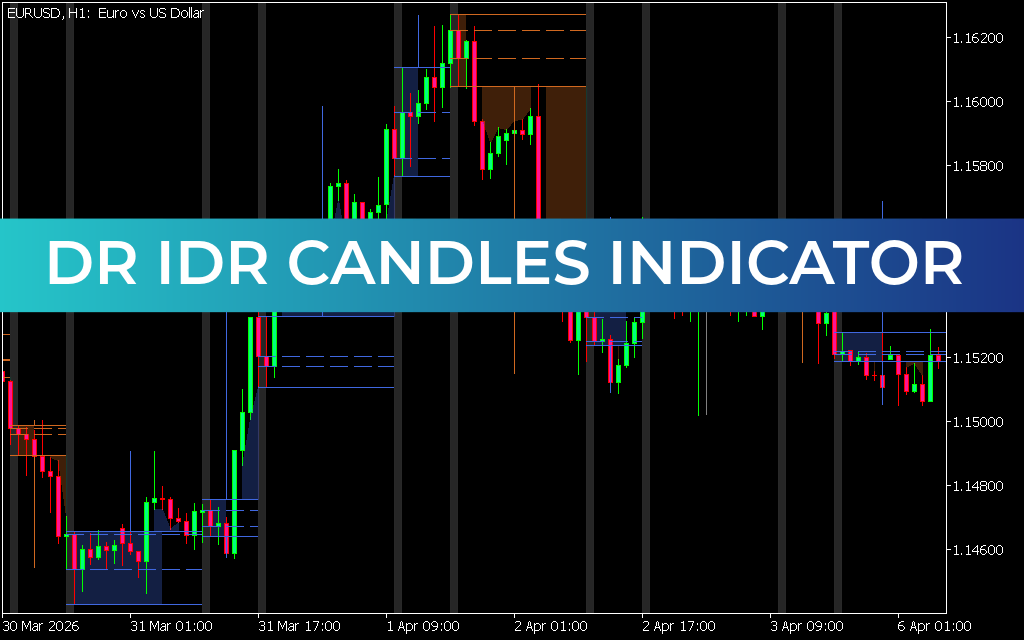
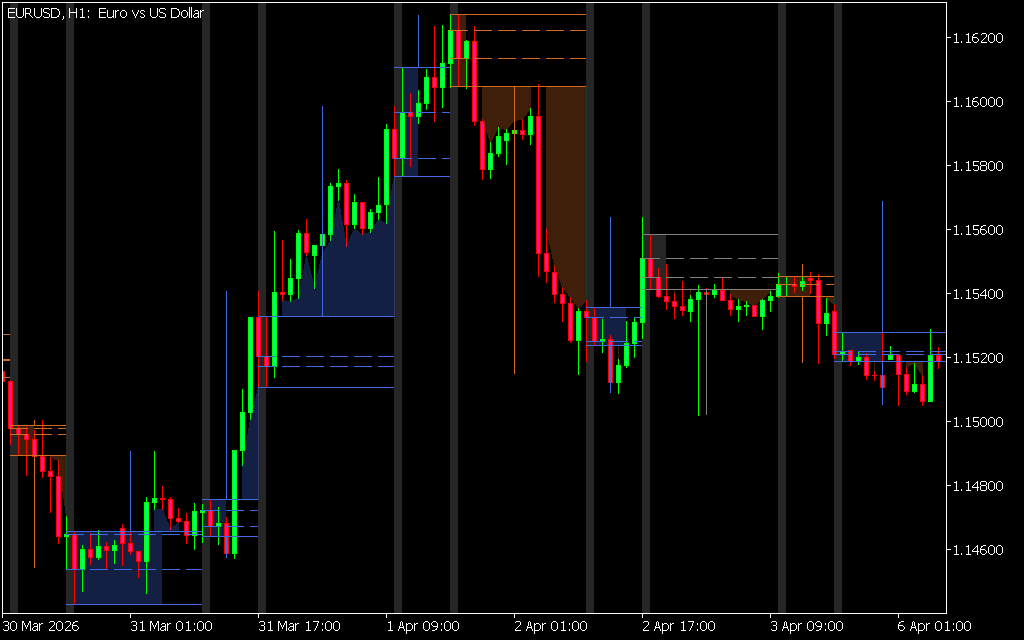
As illustrated in the EUR/USD H1 chart analysis, the indicator provides a clean, visual map of Market Structure:
- The Defining Range (DR): These are the absolute high and low price points reached during the first hour of the trading session. A candle closing outside these levels often signals a trend expansion for the remainder of the day.
- The Implied Defining Range (IDR): This represents a more conservative range, typically focusing on the candle bodies rather than the wicks. The IDR zone acts as a prime "retest" area where institutional traders often look for entries.
- Session Shading: The indicator automatically shades the background or plots boxes to distinguish different trading sessions (London, New York, etc.), ensuring you are always aware of which session’s range is currently in control.
Strategic Advantages for Intraday Traders
The DR IDR Candles Indicator is more than just a Support And Resistance tool; it is a complete framework for session-based trading.
- Defining the Daily Bias: If the price breaks and closes above the DR High, the probability of the day finishing bullish increases exponentially. This allows traders to filter out "sell" signals and focus exclusively on high-probability "buy" setups.
- High-Precision Retest Entries: One of the most successful strategies involves waiting for a "DR Break" followed by a retracement into the IDR shaded zone. This provides a clear, structural entry point with a logical stop-loss placement just below the range.
- Visualizing Liquidity Sweeps: The indicator helps identify "fake-outs" where price briefly pierces the DR High or Low only to reverse. By seeing the range clearly on your MT4 chart, you can avoid falling into institutional liquidity traps.
- Optimized for H1 and M15: While it works across various timeframes, the DR IDR indicator is exceptionally powerful on the Hourly (H1) chart, where session transitions are most visible.
Conclusion
The DR IDR Candles Indicator for MT4 is a definitive tool for any trader who values structural clarity and mathematical objectivity. By automating the most important hour of the trading day, it removes the guesswork from your technical analysis. Elevate your MT4 setup today and start trading within the structural boundaries that the institutions respect.
19 Downloads
Last Update:
Apr 16, 2026 13:55 PM
Published:
Feb 10, 2026 21:09 PM
Category: