The Average Daily Range Indicator measures how much a currency pair moves—on average—over a specific number of previous trading days. Typically, it’s calculated using a 14-day period. The indicator shows the average movement (in pips), which helps traders gauge market volatility and potential price targets.
When the current ADR value is above the historical average, it signals that volatility is increasing. This may indicate strong market momentum or potential breakout opportunities. Conversely, a lower ADR value suggests a quiet, consolidating market.
Key Features and Benefits
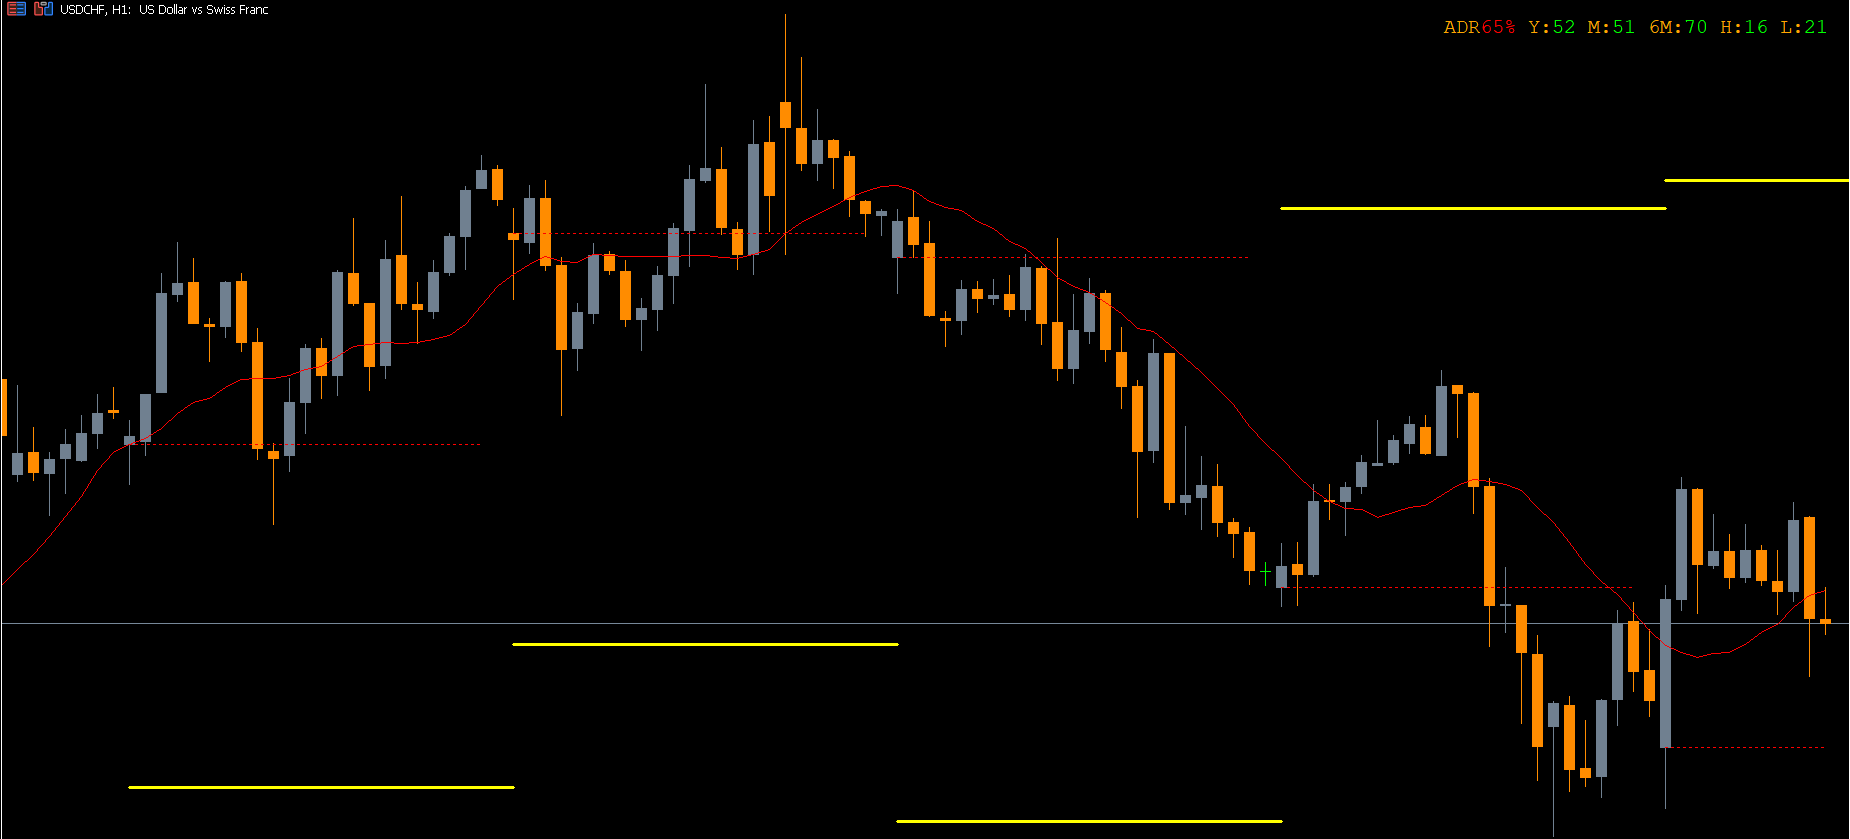
Displays Daily Volatility Instantly: The ADR value is conveniently shown in the upper-left corner of the chart, so traders don’t have to calculate it manually.
Helps Identify Support And Resistance Zones: By analyzing the daily range, traders can pinpoint key price levels where reversals or breakouts may occur.
Useful for Day Traders: ADR helps short-term traders determine whether there’s enough volatility to justify entering trades during the day.
Sets Take-Profit Levels: The ADR value can be used to determine logical take-profit targets based on the average daily range.
Improves Decision Making: Understanding the day’s potential range helps traders avoid overtrading during low-volatility sessions.
How the ADR Indicator Calculates the Average Daily Range
The ADR Indicator uses a simple formula:
It measures the distance between the high and low prices for each day over a selected period (commonly 14 days), adds them up, and divides the total by 14.
Example:
If the last 14 daily ranges of a currency pair are:
55, 76, 34, 42, 66, 89, 65, 45, 22, 101, 78, 33, 67, and 90,
Then:
(55 + 76 + 34 + 42 + 66 + 89 + 65 + 45 + 22 + 101 + 78 + 33 + 67 + 90) ÷ 14 = 61.6 pips
So, the Average Daily Range (ADR) is approximately 62 pips.
How to Trade Using the Average Daily Range Indicator
The ADR Indicator can be applied to both range trading and breakout trading strategies:
Breakout Trading:
When the current ADR value is higher than the previous 14-day average, it signals strong volatility. Traders can enter a buy or sell trade once the high or low of the current day’s candle is broken, following the breakout direction.
Reversal Trading:
When the price reaches the day’s high or low and then bounces back, it can indicate a reversal. Traders can open positions opposite the move, setting take-profit and stop-loss levels based on Price Action and ADR values.
The indicator also assists in timing entries and exits, ensuring that trades are aligned with daily volatility patterns.
Conclusion
The Average Daily Range Indicator for MT5 is a powerful and time-saving volatility analysis tool for Forex traders. By calculating and displaying the average price movement over a 14-day period, it helps identify whether the market is active or quiet, enabling traders to make informed entry and exit decisions.
When the current ADR value is higher than the past 14-day average, volatility is high and price movement is strong. When it’s lower, volatility is weak, and traders can expect a narrow trading range.
📈 Download the ADR Indicator for MT5 today from IndicatorForest.com and improve your trading precision with better volatility insights!
FAQ
13 Downloads
Published:
Nov 10, 2025 03:15 AM
Category: