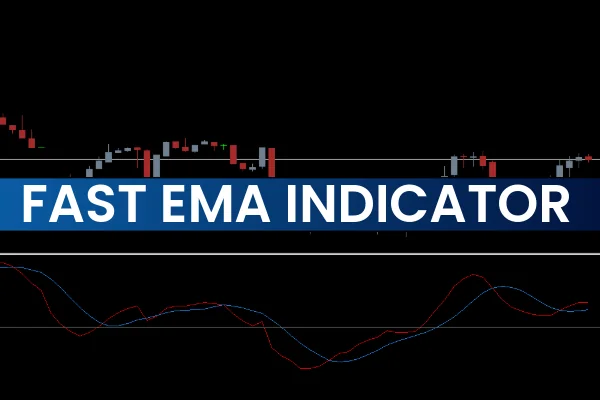
The Fast EMA Indicator is a powerful technical tool designed for traders who rely on moving averages to identify trend direction and generate precise buy and sell signals. Built with two exponential moving averages (EMAs), this indicator mirrors the market’s price behavior in a separate window below the chart. Since the EMAs respond quickly to price changes, traders can use the Fast EMA Indicator for Scalping, intraday strategies, or swing trading.

This indicator features a fast EMA (10 periods) and a slow EMA (25 periods). These two lines oscillate above and below a central zero line, helping traders determine momentum, Trend Strength, and potential reversal zones at a glance. Whether you’re a beginner or an experienced trader, the Fast EMA offers a clean, visual way to interpret market direction.
How the Fast EMA Indicator Works
This indicator operates based on the relationship between its two moving averages. Since EMAs are more responsive than simple moving averages (SMA), they capture short-term volatility while maintaining trend clarity. The crossovers between the fast and slow MAs form the basis of the trading signals.
Understanding the Indicator Layout
Fast EMA (10-period): reacts quickly and provides early trend signals
Slow EMA (25-period): filters noise and confirms trend strength
Zero Line: represents the neutral area between bullish and bearish momentum
When both EMAs are above the zero line, the market is generally bullish. When they dip below, bearish conditions dominate.
How to Trade Using the Fast EMA Indicator
Trading with the Fast EMA is straightforward, even for beginners. The crossovers between the two EMAs determine entry points, while their position relative to the zero line confirms trend direction.
Buy Signal (Long Entry)
A BUY signal is generated when:
The fast EMA crosses above the slow EMA
Both EMAs rise above the zero line
The lines continue trending in the positive region
This setup indicates increasing bullish momentum, making it an ideal entry point for long trades. Traders often look for additional confluence, such as bullish candlestick patterns or support levels, for confirmation.
Sell Signal (Short Entry)
A SELL signal occurs when:
The fast EMA crosses below the slow EMA
Both lines drop below the zero line
Momentum shifts into the negative region
This confirms bearish pressure and presents an opportunity for short positions.
Real Trading Example with the Fast EMA Indicator
The example shown using the EUR/CHF price chart illustrates how accurately the Fast EMA captures trend shifts. When the red fast EMA crosses below the blue slow EMA, the indicator dips under the zero line, signaling a clean sell setup. Following this signal, price continues trending downward.
Later, when the fast EMA crosses back above the slow EMA, both lines move into the positive zone, generating a buy signal. The market responds by entering a sustained bullish phase.
This simple, visual method allows traders to react quickly to momentum changes and stay aligned with the trend.
Best Practices When Using the Fast EMA Indicator
To enhance accuracy, consider these tips:
Combine With Other Indicators
The Fast EMA performs best when paired with:
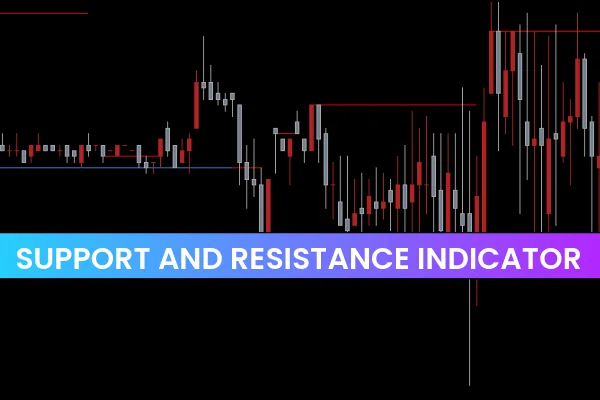
Support And Resistance levels
RSI or Stochastics for momentum confirmation
Price Action patterns
Avoid Choppy Markets
Since EMA crossovers can create false signals in sideways markets, always check higher timeframe trends before entering a trade.
Use Stop Loss and Risk Management
Place stop-loss orders below swing lows for long trades, or above swing highs for short trades.
Conclusion
The Fast EMA Indicator is a simple yet highly effective tool for identifying trend direction and generating reliable buy and sell signals. Its dual EMA crossover system provides clarity and precision, making it suitable for scalpers, day traders, and swing traders alike.
If you want to enhance your technical trading and access more free indicators, be sure to visit IndicatorForest.com and explore our growing library of MT4 and MT5 tools.
FAQ
1 Download
Published:
Nov 17, 2025 21:49 PM
Category: