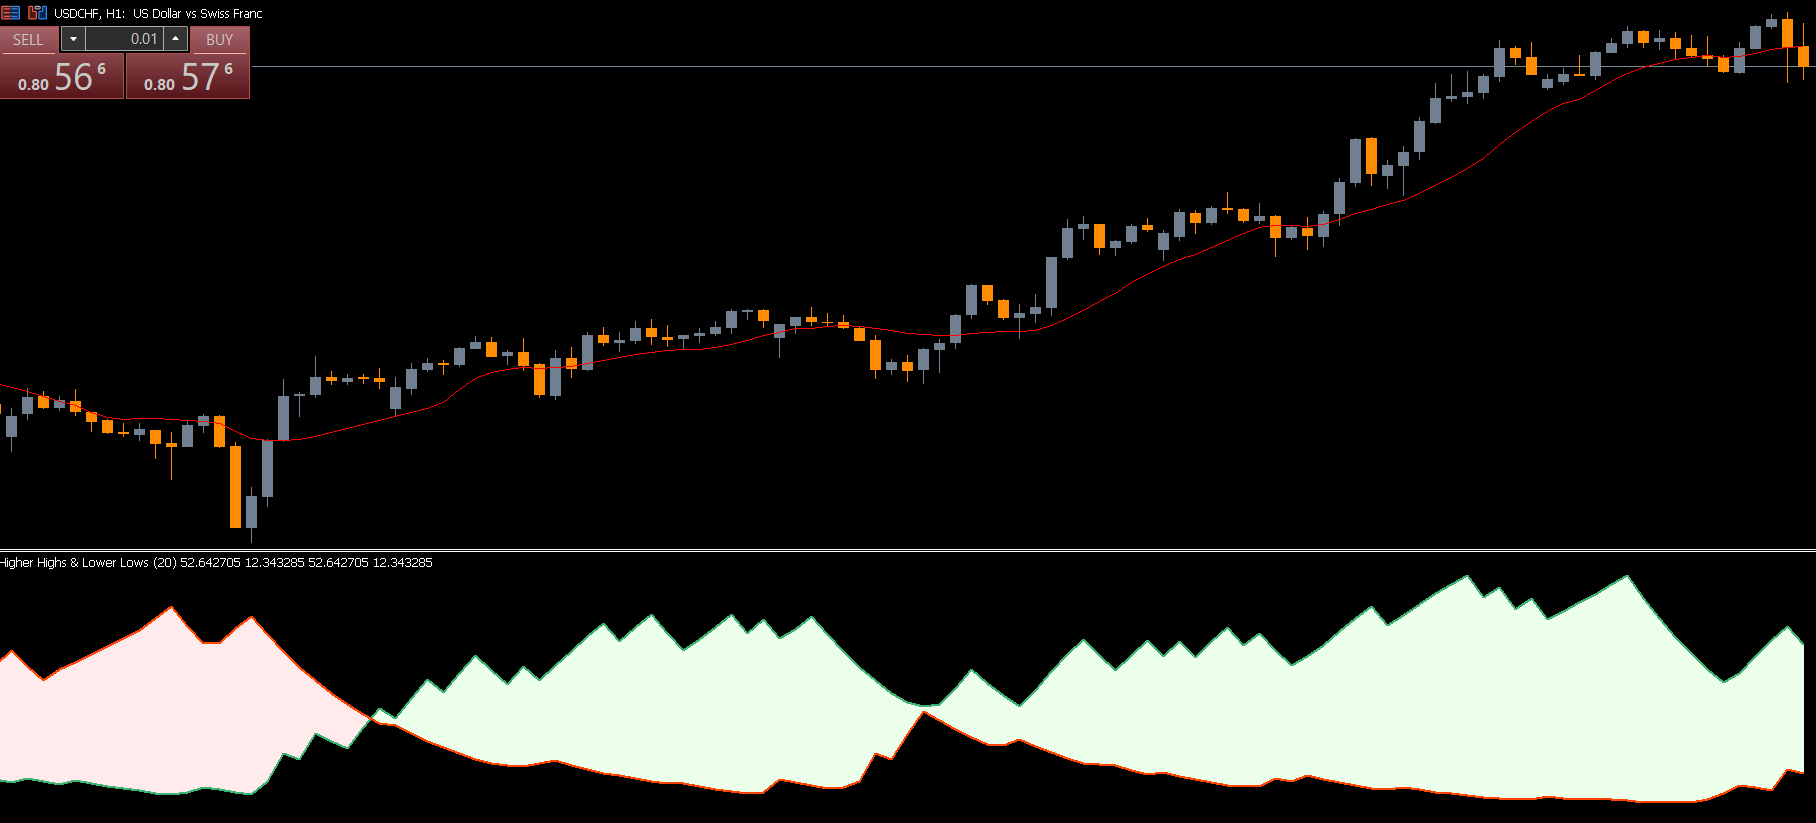
The Higher Highs Lower Lows Indicator MT5 is a powerful trend-detection and reversal-identification tool designed to help forex traders make accurate decisions. This indicator analyzes the formation of higher highs (HH) and lower lows (LL) while blending the logic of classical oscillators. As a result, it provides clear insights into trend direction, price corrections, divergences, and potential turning points in the market.
Because it functions as an oscillator, the Higher Highs – Lower Lows indicator can also highlight overbought and oversold conditions, allowing traders to fine-tune entries and anticipate reversals. Whether you are a beginner or an advanced trader, this tool offers multiple ways to strengthen your technical analysis.
What Is the Higher Highs – Lower Lows Indicator MT5?
The Higher Highs – Lower Lows indicator evaluates price swings by analyzing Market Structure. A higher high suggests bullish pressure, while a lower low signals bearish momentum. The indicator incorporates these concepts into a visual oscillator with two colored trend lines:
Green Line: Represents bullish strength
Red Line: Represents bearish strength
Its unique calculation method combines HH/LL logic with stochastic-style movement, giving traders a hybrid tool that reveals trends, retracements, and momentum shifts.
The indicator works on all timeframes, including:
M1, M5, M15, M30 for intraday trading
H1, H4 for swing trading
Daily, weekly, and monthly for long-term analysis
It is also easy to install and is available as a free MT5 download.
How the Indicator Helps Traders
Identifying Trend Direction Early
A key benefit of the Higher Highs – Lower Lows Indicator MT5 is its ability to detect the birth of a new trend. When the bullish (green) line crosses above the middle level, it indicates that bullish momentum is strengthening. This often becomes an early BUY entry signal.
Likewise, when the bearish (red) line crosses below the middle level, sellers begin dominating the market, generating a SELL opportunity.
Spotting Price Corrections
Price corrections appear as temporary counter-trends. The indicator makes it easy to identify these moments because the oscillator retraces even if the main trend remains intact. Traders can use the retracement dips to add new positions or prepare for reversals.
Overbought and Oversold Conditions
As an oscillator, the indicator helps determine whether the market is overbought or oversold. When the lines approach extreme levels, traders know that exhaustion is near and a reversal may be forming. This is especially useful when combined with:
Trendlines
Divergence setups
Divergence Signals
Divergences occur when price makes a new high or low but the indicator does not follow. For example:
Bearish Divergence: Price makes a higher high, but indicator makes a lower high → SELL
Bullish Divergence: Price makes a lower low, but indicator makes a higher low → BUY
This helps traders anticipate early reversal points.
Higher High – Lower Low Indicator Trading Signals
Trading with the indicator is straightforward thanks to its clear visual design:
Green Line Crossing Middle Level → BUY Signal
This indicates bullish strength and often works as the best entry during uptrends.
A wider divergence between the green and red lines suggests a stronger trend.
Red Line Crossing Middle Level → SELL Signal
This shows bearish pressure and confirms a potential downtrend.
These signals help traders determine the best entry and exit points while staying aligned with trend momentum.
Conclusion
The Higher Highs – Lower Lows Indicator for MT5 is a flexible and highly valuable tool for forex traders. By combining HH/LL logic with oscillator mechanics, it effectively highlights the beginning and exhaustion of bullish and bearish trends. Traders can use it for trend trading, reversal trading, divergence spotting, and momentum analysis. The indicator is simple to install, free to download, and suitable for all timeframes.
For more free trading tools and professional MT4/MT5 indicator guides, visit IndicatorForest.com.
FAQ
2 Downloads
Published:
Nov 20, 2025 09:52 AM
Category: