The DTOSC Indicator MT5 (Dynamic Trader OSCillator) is a unique combination of the RSI (Relative Strength Index) and Stochastic oscillator, designed to identify overbought and oversold market conditions. Forex traders use this hybrid indicator to anticipate potential trend reversals and generate reliable buy and sell signals through signal line crossovers.
Whether you are a beginner or an experienced trader, the DTOSC Indicator offers a clear and effective way to analyze market momentum on multiple timeframes, including daily, weekly, and monthly charts.
How the DTOSC Indicator MT5 Works
At its core, the DTOSC Indicator calculates two dynamic lines that move within a range, typically between 0 and 100. These lines represent market momentum derived from RSI and stochastic values.
When the green line crosses above the red line, it indicates bullish momentum—a potential buying opportunity.
Conversely, when the green line crosses below the red line, it signals bearish momentum, suggesting a possible sell setup.
These crossover points are highly valuable, allowing traders to time their entries based on the Trend Reversal strength and market sentiment.
DTOSC Indicator Trading Strategy
Buy Signal Strategy
Watch for the green line to cross above the red line.
Confirm the crossover occurs below the 30 level, indicating oversold conditions.
Place a buy order when the crossover forms.
Set a stop loss just below the recent swing low.
Sell Signal Strategy
Look for the green line to cross below the red line.
Confirm the crossover happens above the 70 level, signaling overbought conditions.
Place a sell order once the crossover forms.
Set a stop loss above the previous swing high.
Exit Strategy
Use the opposite crossover as your exit signal.
Alternatively, target a 1:2 or better risk/reward ratio for profit-taking.
Multi-Time Frame (MTF) Trading Approach
One of the greatest advantages of the DTOSC Indicator for MT5 is its ability to perform effectively on multiple timeframes.
On lower timeframes (M15–H1), traders can capture short-term price swings.
On higher timeframes (H4–D1), it helps filter out market noise and spot long-term trends.
By combining signals from higher and lower timeframes, traders can increase accuracy and reduce false entries — a strategy known as multi-time frame confirmation.
Why Use the DTOSC Indicator MT5
Simple and easy to interpret
Combines RSI and Stochastic for high accuracy
Ideal for swing and trend trading
Works on all currency pairs and timeframes
Perfect for both beginners and professionals
This makes the DTOSC Indicator MT5 a valuable tool for traders seeking a structured, data-driven approach to identify optimal trade entry and exit points.
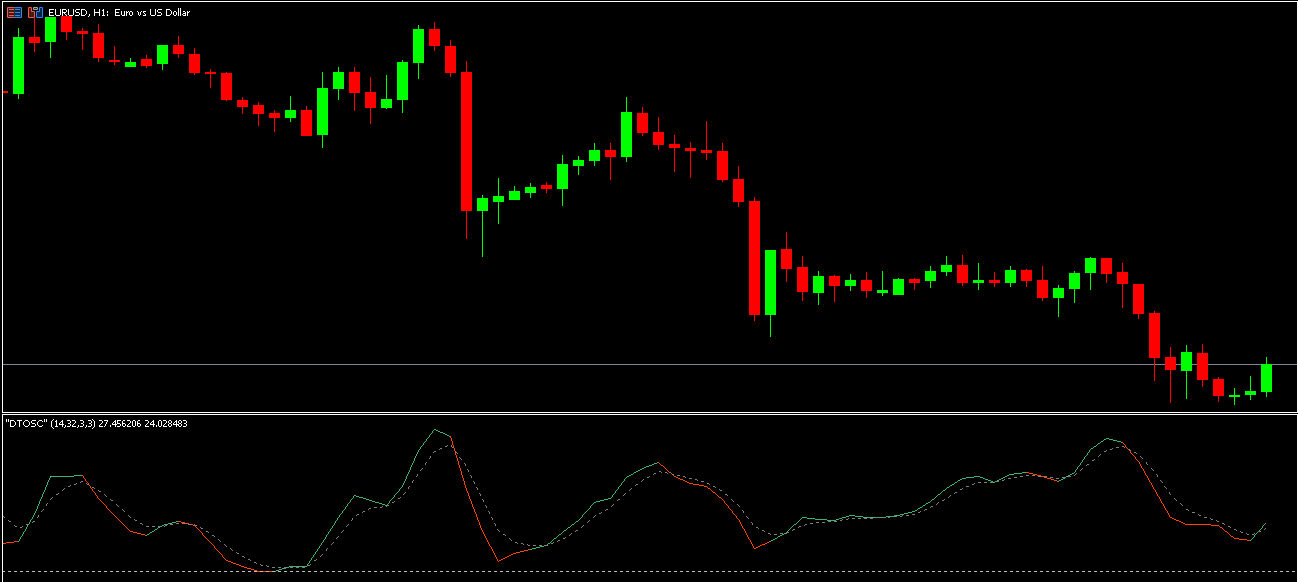
Example: DTOSC Indicator on EUR/USD H1 Chart
When applied to the EUR/USD H1 chart, the DTOSC indicator displays two colored lines (green and red) in a separate window.
A green line crossing above the red line indicates the start of a bullish cycle.
A green line crossing below the red line marks the beginning of a bearish trend.
Traders can rely on these crossovers to time their trades effectively, using clear visual confirmation rather than guesswork.
Conclusion
The DTOSC Indicator for MT5 stands out as a trend-following oscillator that merges RSI and stochastic principles to pinpoint market reversals and entry points. Its simplicity and flexibility make it an excellent addition to any trading system.
For best results, combine DTOSC signals with Price Action or Support And Resistance analysis.
Download premium and free Forex indicators like DTOSC at IndicatorForest.com — your trusted source for professional trading tools.
5 Downloads
Last Update:
Nov 01, 2025 02:36 AM
Published:
Oct 31, 2025 14:42 PM
Category: