The Market Facilitation Index (MFI) indicator was developed by Bill Williams as part of the early versions of his renowned trading system described in Trading Chaos. Williams introduced this tool as a unique method for analyzing the relationship between price movement and trading volume. Although he emphasized that his system does not belong to classical technical analysis, many of his indicators—including Alligator, Awesome Oscillator (AO), and Accelerator Oscillator (AC)—are essentially modified moving averages or oscillators.
The MFI indicator stands out because it helps traders understand how effectively the market reacts to volume changes. Instead of simply showing direction or overbought/oversold conditions, the MFI reveals how eager the market is to move based on the interaction of price and volume.
Market Facilitation Index Formula Explained
The MFI is calculated using a straightforward formula:
MFI = (High – Low) / Volume
Where:
High – the highest price of the current candle
Low – the lowest price of the current candle
Volume – tick volume of the candle
The concept behind this formula is simple: the greater the price range relative to volume, the more “willingness” the market has to move.
How the Market Facilitation Index Works
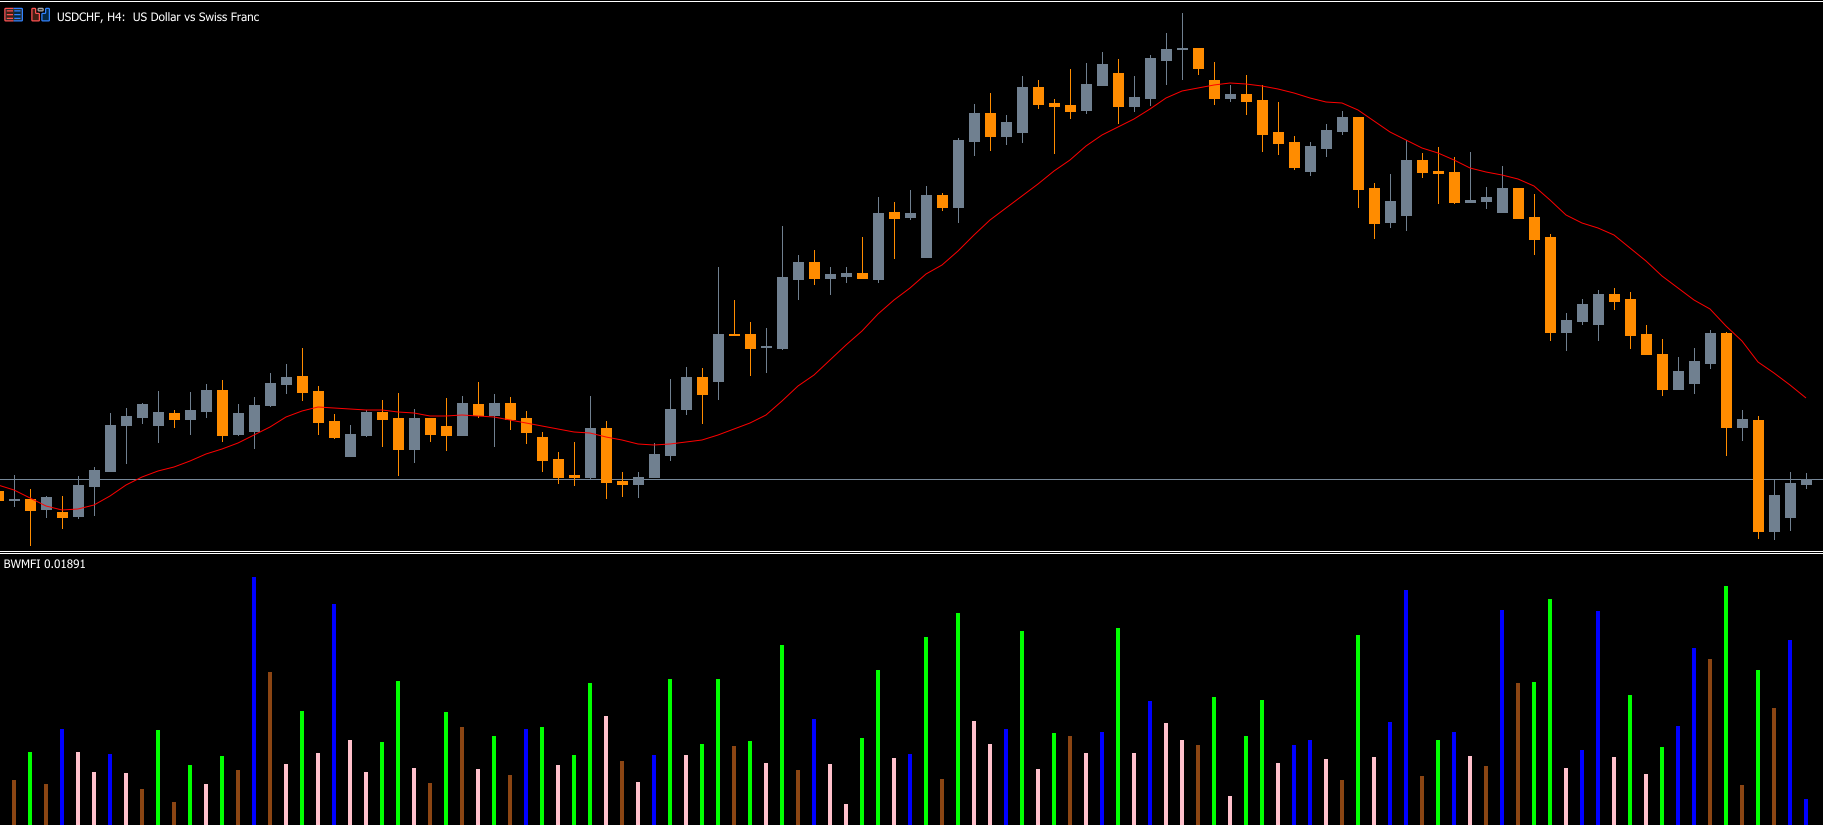
The MFI is displayed as a histogram consisting of colored bars. Each color represents a unique market condition and provides important clues about Trend Strength, trader interest, and potential reversals.
Below are the four bar types and their meaning:
Green Bar – Trend Strengthening
A green bar signals increasing market volume and increasing price movement. This usually indicates that new traders are entering the market and fueling the current trend.
Not an ideal entry point because the move is already strong
Best used as confirmation for existing positions
Brown Bar – Trend Weakening
The brown bar shows decreasing volume and decreasing price movement. This indicates that the trend is losing momentum.
Often appears before a sideways market
Avoid opening counter-trend positions because a reversal is not guaranteed
Blue Bar – Movement Without Volume
A blue bar indicates that the price is moving but without strong participation from traders. This usually reflects a weak or uncertain market environment.
Trend continuation becomes unlikely
Price may stop or reverse at any moment
Pink Bar – Potential Trend Reversal
The pink bar is the most powerful signal. It shows increasing price movement combined with decreasing volume, suggesting strong activity from both buyers and sellers.
Often appears before major reversals
Used as the primary setup for entry signals in trading strategies
Trading Strategy Using the MFI Indicator
Below is a simple and effective strategy based on the appearance of the pink bar, which signals possible market reversal points.
Buy Setup
Wait for a pink bar to appear.
Place a pending Buy Stop a few pips above the last local high.
Set Stop Loss below the last local low.
Set Take Profit at 2–3× the stop-loss size, considering key support/resistance levels.
Sell Setup
Wait for a pink MFI bar.
Place a pending Sell Stop a few pips below the last local low.
Set Stop Loss above the recent high.
Set Take Profit 2–3× the SL distance.
This strategy works best when combined with trend filters such as Bill Williams’ Alligator or a simple moving average to avoid entering against strong market trends.
Displaying the Market Facilitation Index
The MFI indicator is easy to interpret thanks to its four-color bar histogram. Traders often use it to identify:
imminent reversals
market participation strength
early signs of consolidation
While all bar colors are useful, the pink bar is the most important, often marking the beginning of a major trend shift.
Conclusion
The Market Facilitation Index indicator is a valuable tool for analyzing how price reacts to changes in trading volume. Its color-coded histogram makes market interpretation simple, even for beginners. By understanding each bar type and applying the pink-bar strategy, traders can catch early reversals and validate trend strength effectively.
For more free indicators, MT4 systems, and EA downloads, visit IndicatorForest.com.
FAQ
3 Downloads
Published:
Nov 13, 2025 21:17 PM
Category: