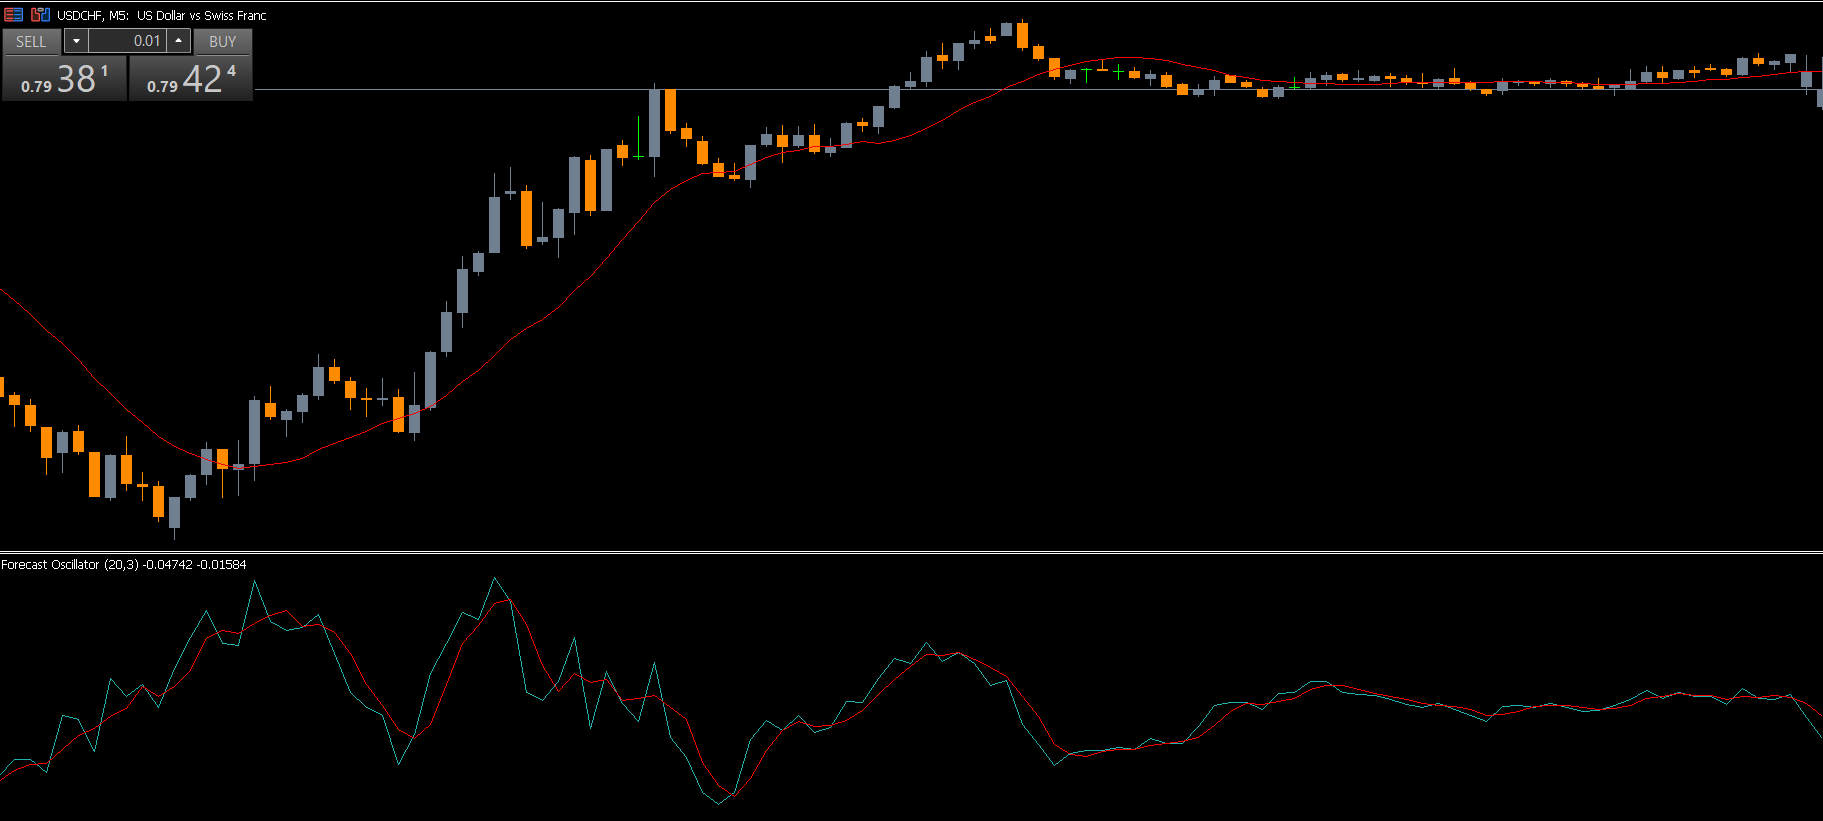
The Forecast Oscillator for MT5 is a powerful technical analysis tool that helps traders predict potential price movements using time series analysis and linear regression. Unlike traditional regression channel indicators, this oscillator provides a signal line and an SMA, allowing traders to compare current prices with forecasted values. By doing so, it generates actionable buy and sell signals along with entry, exit, and overbought/oversold information.
This indicator is suitable for both new and experienced traders, providing a visual and statistical approach to forecasting price trends in the Forex market. Its unique ability to analyze the relationship between the actual price and predicted values makes it an indispensable tool for intraday and swing trading.
How the Forecast Oscillator Works
Time Series Forecast Using Linear Regression
The core of the indicator is linear regression, which analyzes the upper and lower bounds of an existing trend. The oscillator calculates a forecasted value based on past price data and compares it to the current closing price. This difference is expressed as a percentage, helping traders understand whether the price is moving in line with its expected trend or diverging.
Signal Line and SMA
The Forecast Oscillator plots two primary lines:
Signal line: Highlights buy and sell opportunities based on divergence from the forecast.
SMA line: Smooths the forecast to filter noise and enhance signal clarity.
This combination allows traders to monitor both short-term deviations and overall trend direction.
Trading Signals
Buy Signals
A buy signal occurs when:
The oscillator stays above the zero line
A blue dot appears on the chart
This indicates a potential upward movement, suggesting traders consider opening long positions or holding existing bullish trades.
Sell Signals
A sell signal occurs when:
The oscillator remains below the zero line
A purple dot appears
This signals a potential downtrend, allowing traders to anticipate market reversals or exit long positions safely.
Overbought and Oversold Levels
The oscillator also highlights overbought and oversold conditions, helping traders identify areas where the market may be reversing. These levels provide additional confirmation for entering or exiting trades.
Why Use the Forecast Oscillator for MT5?
Predictive Insights – Helps anticipate future price movements rather than just reacting to current market conditions.
Clear Buy/Sell Signals – Visual markers (blue and purple dots) make it easier to spot potential entries and exits.
Supports Risk Management – Overbought and oversold levels help traders set stop-loss and take-profit points more effectively.
User-Friendly – Free to download and easy to integrate into any MT5 chart.
Applicable Across Timeframes – Can be used on intraday, daily, or swing trading strategies for added flexibility.
Conclusion
The Forecast Oscillator for MT5 is an essential tool for traders who rely on predictive analytics and trend forecasting. By combining linear regression, a signal line, and SMA smoothing, it generates clear buy and sell signals while highlighting overbought and oversold conditions. This makes it easier to plan trades, manage risk, and improve overall trading accuracy.
Traders can download the Forecast Oscillator Indicator for MT5 for free and integrate it into their trading setup to enhance market forecasting and decision-making
FAQ
1 Download
Last Update:
Nov 16, 2025 11:51 AM
Published:
Nov 16, 2025 11:49 AM
Category: