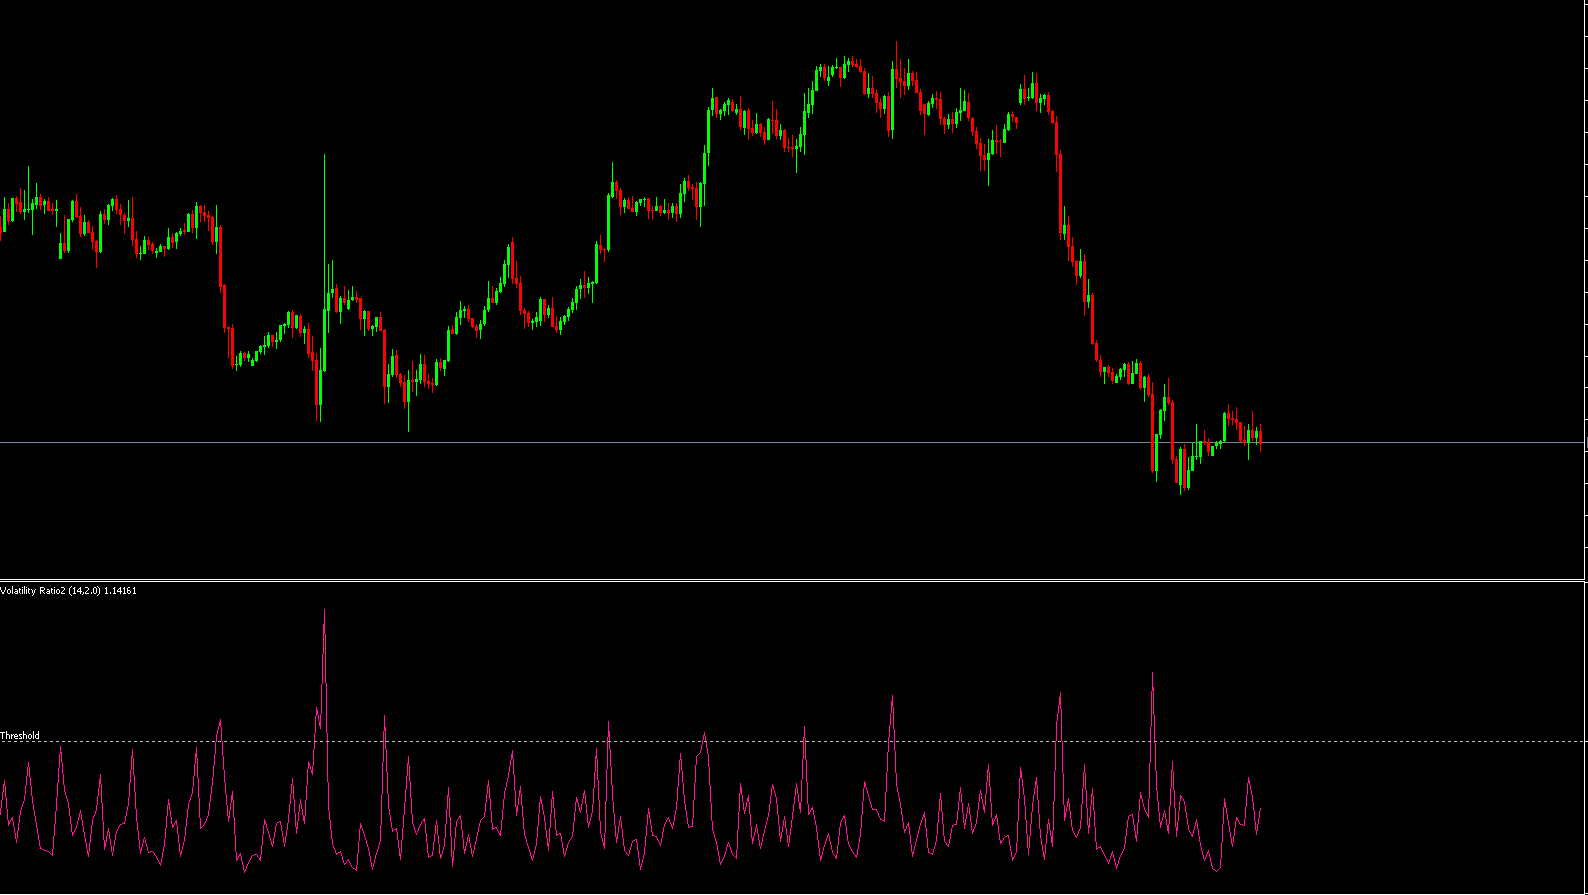
The Volatility Ratio 2 Indicator for MT5 is a powerful breakout trading tool designed for MetaTrader 5 users. It helps traders identify periods when price action breaks beyond its usual range — signaling a potential reversal or continuation move. The indicator uses volatility analysis to pinpoint these opportunities, making it especially useful for breakout traders seeking precision and early entries.
The formula behind the indicator is straightforward yet effective:
Today’s True Range ÷ N Days True Range
This ratio helps determine whether today’s market volatility is significantly higher than the average volatility of the past few sessions. A reading above a certain threshold (commonly 0.5 or higher) suggests a potential breakout situation.
To understand how the Volatility Ratio 2 Indicator for MT5 functions, it’s essential to grasp the concept of true range. The true range measures market volatility by comparing today’s high and low with the previous close. By dividing today’s true range by the average true range of a set period (N days), the indicator calculates how “volatile” the current session is relative to past sessions.
When volatility exceeds the norm, the market may be gearing up for a breakout. The indicator visually displays this by plotting colored dots and arrows on the chart:
🔵 Blue Arrow/Dot – Indicates a buy signal (potential bullish breakout)
🔴 Red Arrow/Dot – Indicates a sell signal (potential bearish breakout)
Traders can apply this indicator on any instrument or timeframe, from forex pairs like GBP/USD to commodities, indices, or cryptocurrencies.
The main idea of using this indicator is to detect when price movement steps outside its historical range — a key sign of momentum shift.
Here’s a simple step-by-step trading approach:
Identify Breakout Conditions:
Look for readings near or above the 0.5 level. A value of 2 means the current range is twice the average range — a strong sign of increased volatility.
Confirm with Other Indicators:
Combine the Volatility Ratio 2 Indicator with volume or moving average tools. For example, a breakout confirmed by rising volume increases signal reliability.
Enter on Arrow Signals:
Enter buy trades when a blue arrow and dot appear.
Enter sell trades when a red arrow and dot appear.
Set Stop-Loss and Take-Profit Levels:
Use recent swing highs or lows for stop-loss placement, and aim for a 1.5–2x risk-to-reward ratio.
Adjust for Market Conditions:
Volatility changes with sessions and news events. Customize your parameters for different timeframes and instruments to maintain accuracy.
Consider a GBP/USD chart where the Volatility Ratio 2 Indicator shows a blue dot under the price. Shortly after, a blue arrow appears on the price chart. This combination indicates a bullish breakout — a signal to buy. Conversely, when a red arrow forms, it’s a sign to prepare for a potential reversal or bearish breakout.
This simple visual system makes it easy for both beginner and advanced traders to react quickly to market changes.
Accurate Breakout Detection: Identifies early momentum shifts before large moves.
Universal Application: Works across all markets and timeframes.
Clear Visual Signals: Easy-to-read arrows and dots for actionable insights.
Customizable Parameters: Adjust volatility sensitivity for different strategies.
By incorporating the Volatility Ratio 2 Indicator into your trading system, you gain a reliable edge in spotting breakout setups — whether in forex, stocks, or crypto.
A volatility factor of 2 is ideal for detecting significant price breakouts. The Volatility Ratio 2 Indicator for MT5 simplifies this process by plotting intuitive buy and sell signals directly on your chart.
If you’re a breakout trader looking for accurate, rule-based signals, this indicator is a perfect addition to your strategy.
👉 Download the Volatility Ratio 2 Indicator for MT5 today at IndicatorForest.com and start enhancing your breakout trading performance.
Published:
Oct 30, 2025 05:35 AM
Category: