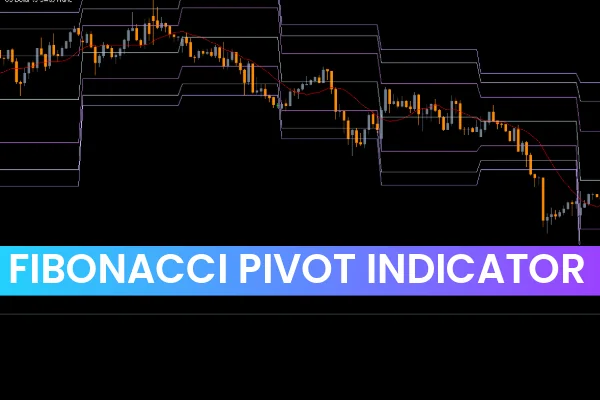
The Fibonacci Pivot Indicator for MT5 is a powerful support-and-resistance tool designed for beginners and experienced traders who rely on accurate technical levels to understand market direction. Pivot points are widely used to identify trend bias, while Fibonacci ratios enhance precision by adding mathematically significant reversal zones. When combined, the Fibonacci Pivot system becomes a complete framework for identifying Trend Strength, reversal points, and intraday trading opportunities.
This indicator automatically calculates pivot points and Fibonacci-based Support And Resistance levels, giving traders reliable stop-loss zones and multiple take-profit targets. It is especially useful in volatile markets where clear directional bias and structured levels are needed.
Understanding the Fibonacci Pivot Indicator for MT5
The Fibonacci Pivot Indicator blends two powerful concepts:
Traditional Pivot Points
Fibonacci Ratios (38.2%, 61.8%, 76.4%)
Pivot points are calculated from the previous day’s high, low, and close. These values form the basis of intraday levels that predict potential support and resistance. The addition of Fibonacci ratios enhances accuracy by creating stronger, more meaningful levels used by traders around the world.
Most traders begin their day by marking key support and resistance zones. However, manually calculating these levels every session is time-consuming. The Fibonacci Pivot Indicator for MT5 removes this burden by automatically generating pivot, support, and resistance levels, making it ideal for traders of all skill levels.
Why Fibonacci Pivot Levels Matter
Fibonacci numbers have long been valued in forex trading for their natural alignment with Market Structure. When applied to pivot points, the resulting levels give traders:
More reliable reversal zones
Stronger support and resistance
Better-defined take-profit targets
Consistent trend prediction
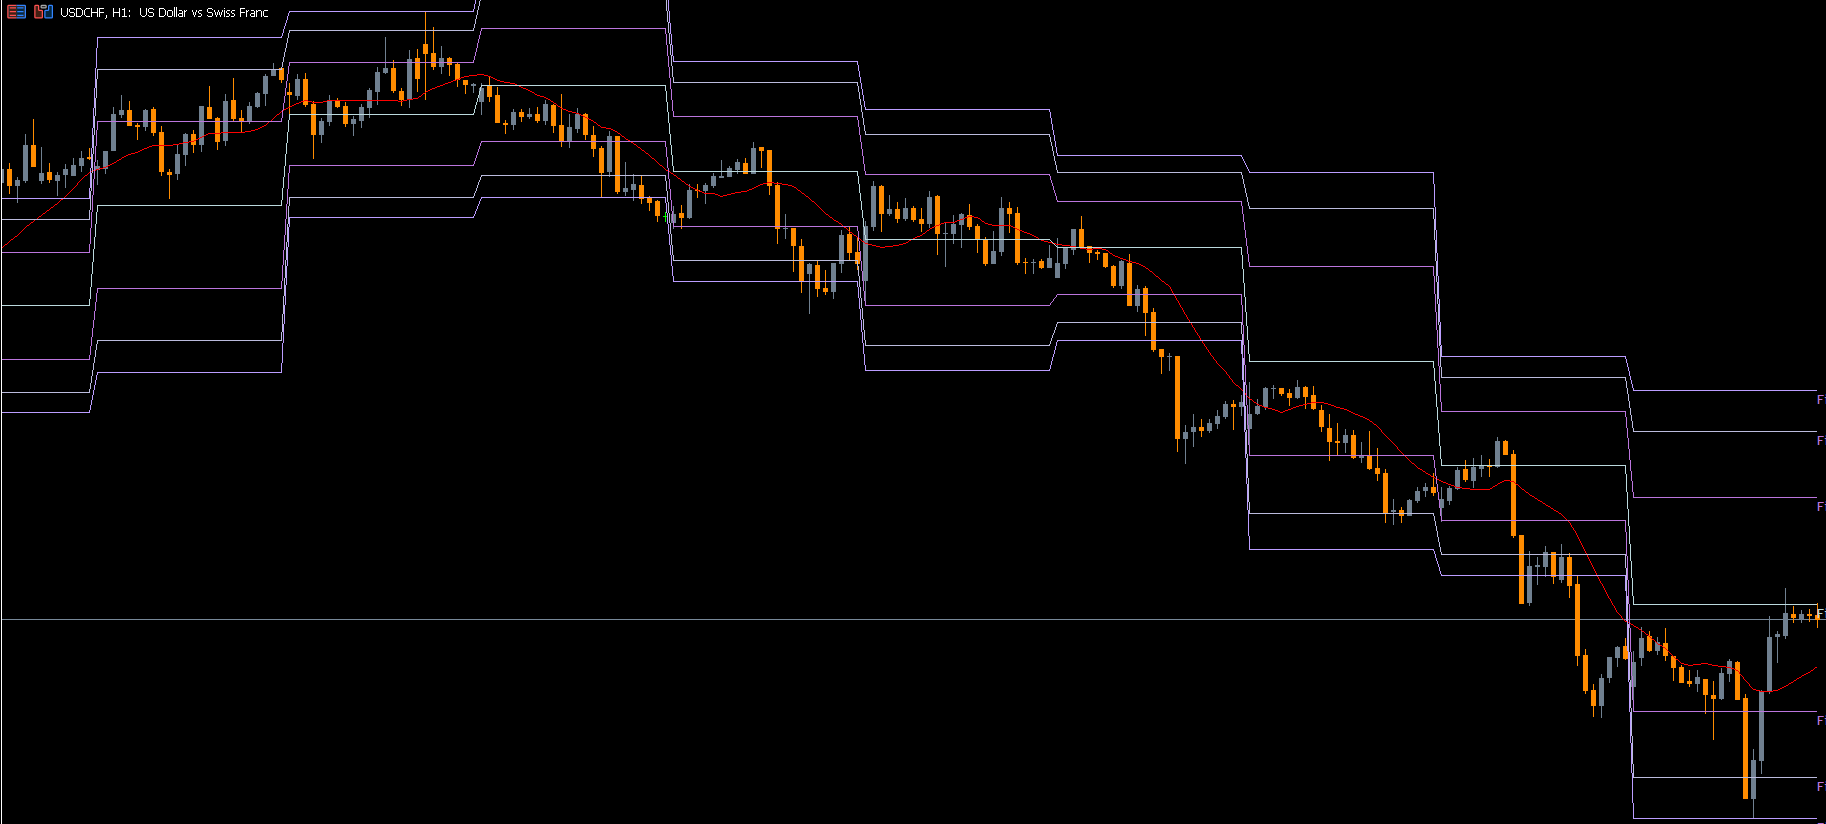
The Fibonacci pivot model calculates three layers each of support and resistance, providing traders with multiple levels to manage risk and reward.
How to Trade Using the Fibonacci Pivot Indicator for MT5
Buy Strategy
A BUY position is triggered when price crosses the reference (pivot) level upward. Once the trend direction is established:
R1 becomes Take Profit 1
R2 becomes Take Profit 2
R3 becomes Take Profit 3
Traders often scale out or take partial profits at each resistance. A stop loss is placed below S1, providing a conservative buffer against false breakouts.
Managing Positions:
If price reaches R1, the stop can be moved to breakeven.
If price continues to R2, the stop can be locked at R1.
As price moves beyond R2 toward R3, the stop can be trailed to protect additional gains.
Sell Strategy
A SELL order is triggered when price crosses below the pivot level. In this scenario, S1, S2, and S3 become logical take-profit targets, while stop loss is placed above R1 for risk control.
Fibonacci Pivot Formulas
These are the exact formulas used by the indicator:
Pivot = (Previous High + Previous Low + Previous Close) / 3
Resistance 1 (R1) = Pivot + (Previous High – Previous Low) * 0.382
Support 1 (S1) = Pivot – (Previous High – Previous Low) * 0.382
Resistance 2 (R2) = Pivot + (Previous High – Previous Low) * 0.618
Support 2 (S2) = Pivot – (Previous High – Previous Low) * 0.618
Resistance 3 (R3) = Pivot + (Previous High – Previous Low) * 0.764
Support 3 (S3) = Pivot – (Previous High – Previous Low) * 0.764
These levels represent mathematical zones where price may reverse or bounce, providing structured trading opportunities.
Limitations of the Fibonacci Pivot Indicator
While powerful, the indicator has certain limitations:
Market dynamics may shift rapidly and not always follow the pivot-based trend bias.
Support and resistance levels are mathematically generated, not guaranteed.
Extra confirmation from Price Action, trend indicators, or volume tools is recommended.
For the best results, traders should combine Fibonacci Pivot levels with Candlestick Patterns, moving averages, or momentum indicators.
Conclusion
The Fibonacci Pivot Indicator for MT5 offers a disciplined way to identify support, resistance, and potential reversal levels using the combined strength of pivot points and Fibonacci ratios. Whether you’re a beginner or a seasoned trader, this indicator helps map out market structure, set precise stop losses, and plan multiple take-profit targets with confidence.
To explore more MT4 and MT5 indicators, expert advisors, and trading tools, visit IndicatorForest.com and expand your trading arsenal.
FAQ
4 Downloads
Published:
Nov 15, 2025 10:56 AM
Category: