Unlock Precision Trading with the Glasneba Indicator
In the highly competitive arena of Forex trading, having a multi-dimensional view of the market is the key to consistent profitability. While most traders rely on single-line oscillators that offer a narrow perspective, professional chartists seek out tools that provide a comprehensive analysis of trend, momentum, and volume simultaneously. The Glasneba Indicator is a sophisticated technical solution designed to do exactly that, offering a robust framework for identifying high-probability trade setups.
What is the Glasneba Indicator?
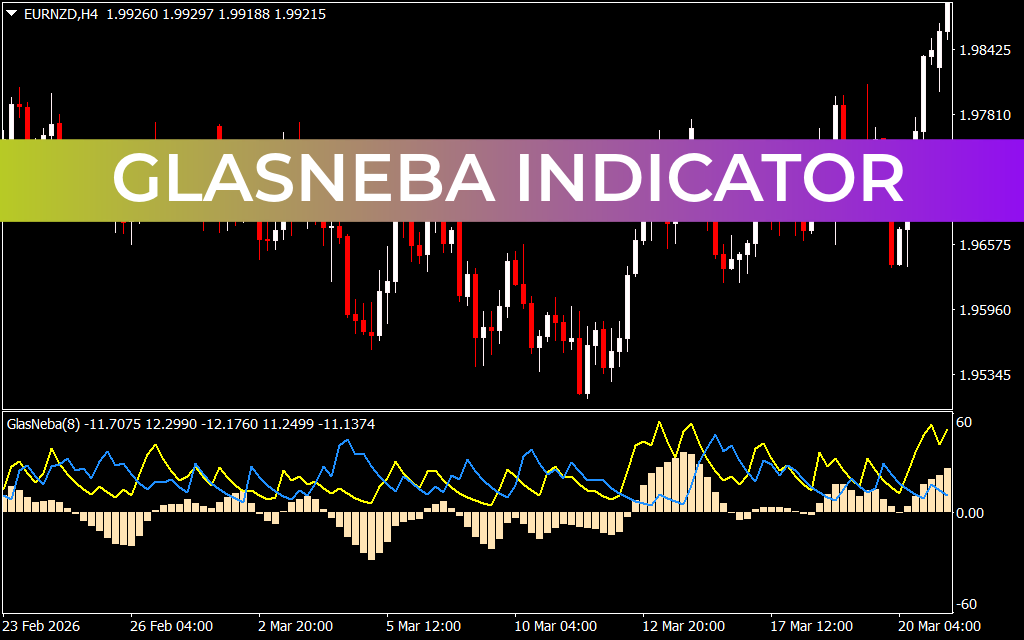
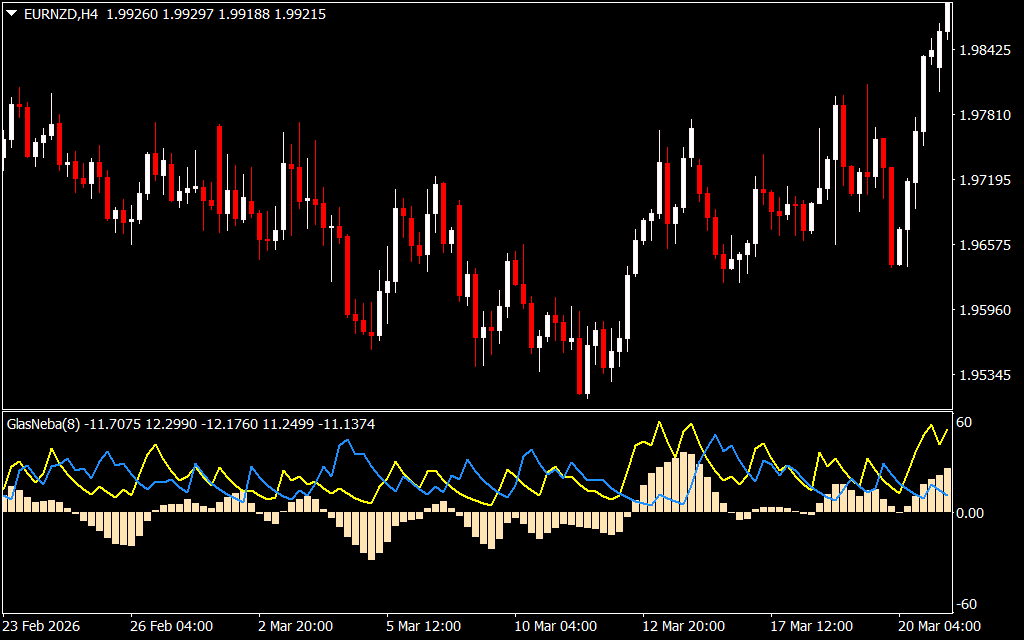
The Glasneba Indicator is a comprehensive technical analysis tool developed for the MetaTrader platform. It is categorized as a "hybrid oscillator" because it combines multiple data streams—including price velocity and historical averages—into a singular, easy-to-read visual interface. As shown in the EURNZD H4 chart, the indicator resides in a dedicated sub-window, featuring a combination of a central histogram and dual signal lines (typically blue and yellow).
Decoding the Visual Signals
The power of the Glasneba Indicator lies in its layered approach to market data:
- The Histogram (The Core): The bars fluctuating around the zero level represent the underlying strength of the market. When the histogram is above zero and growing, bullish momentum is accelerating. Conversely, bars below the zero line indicate dominant bearish pressure.
- The Signal Lines: The blue and yellow lines provide the "timing" component of the indicator. When these lines cross or diverge from the histogram, they signal potential entry and exit points.
- The Zero-Line Cross: A fundamental signal occurs when both the lines and the histogram cross the median zero point, confirming a major shift in the mid-to-long-term trend.
Strategic Advantages for Traders
The Glasneba Indicator excels at filtering out "market noise"—those small, erratic price movements that often trigger false signals in lesser indicators. By requiring alignment between the histogram and the signal lines, traders can ensure they are entering a move with genuine weight behind it.
Furthermore, the indicator is exceptional at spotting divergences. If the price of an asset makes a new high but the Glasneba histogram fails to surpass its previous peak, a reversal is often imminent. This "early warning system" allows traders to exit positions before a trend collapse, protecting capital and locking in gains.
How to Integrate Glasneba into Your Workflow
While powerful on its own, the Glasneba Indicator serves as an excellent foundation for a complete trading system. Traders often use it to confirm breakouts from Support And Resistance levels. For instance, a breakout above a resistance zone is considered much more reliable if the Glasneba histogram is simultaneously rising into positive territory.
Whether you are a day trader looking for intraday swings or a long-term investor seeking major trend shifts, the Glasneba Indicator provides the clarity and depth needed to navigate the markets with confidence.
1 Download
Last Update:
Apr 25, 2026 22:29 PM
Published:
Feb 02, 2026 14:11 PM
Category: