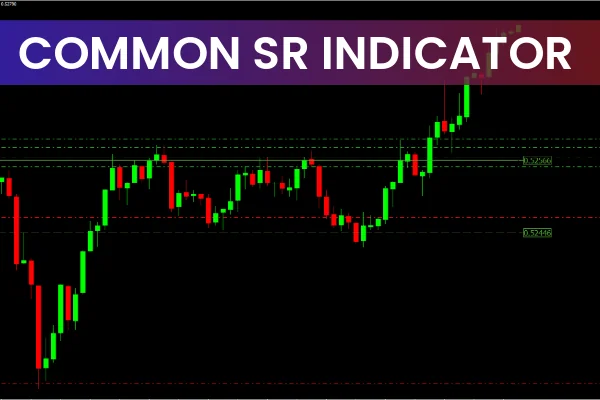
The Common SR Indicator for MT4 is a powerful and easy-to-use trading tool designed to highlight major Support And Resistance levels on your chart. These are critical areas where price has historically reversed, paused, or consolidated — giving traders valuable insights into potential entry and exit zones.
Unlike basic price level markers, this indicator automatically detects previous highs and lows of the day, week, or month, allowing traders to track where market participants are likely to react. Whether you’re a scalper, day trader, or swing trader, the Common SR Indicator helps you trade confidently by visualizing the levels that matter most.
What Makes the Common SR Indicator Unique
Support and resistance are at the heart of technical analysis. However, manually identifying these levels can be time-consuming and subjective. The Common SR Indicator for MT4 simplifies this by automatically plotting these zones, ensuring your chart remains clean and informative.
Support levels: Zones where price has historically bounced upward.
Resistance levels: Zones where price tends to reject and move downward.
By focusing on historical highs and lows, this indicator gives traders a clear view of potential reversal points and market structure.
What Is the Best Support and Resistance Indicator?
There’s no single “best” Support And Resistance Indicator — different tools serve different purposes.
For example:
Fibonacci retracement levels highlight potential reversal zones in trending markets.
Pivot points provide intraday reference levels for scalpers.
Price Action analysis reveals structure without any indicators.
However, the Common SR Indicator stands out as one of the most accurate and trader-friendly tools because it pinpoints key reversal levels used by institutional traders and market makers. These zones often act as liquidity pockets where large buy or sell orders are executed, making them ideal for strategic trade placement.
How to Trade with the Common SR Indicator
Identifying Key Levels
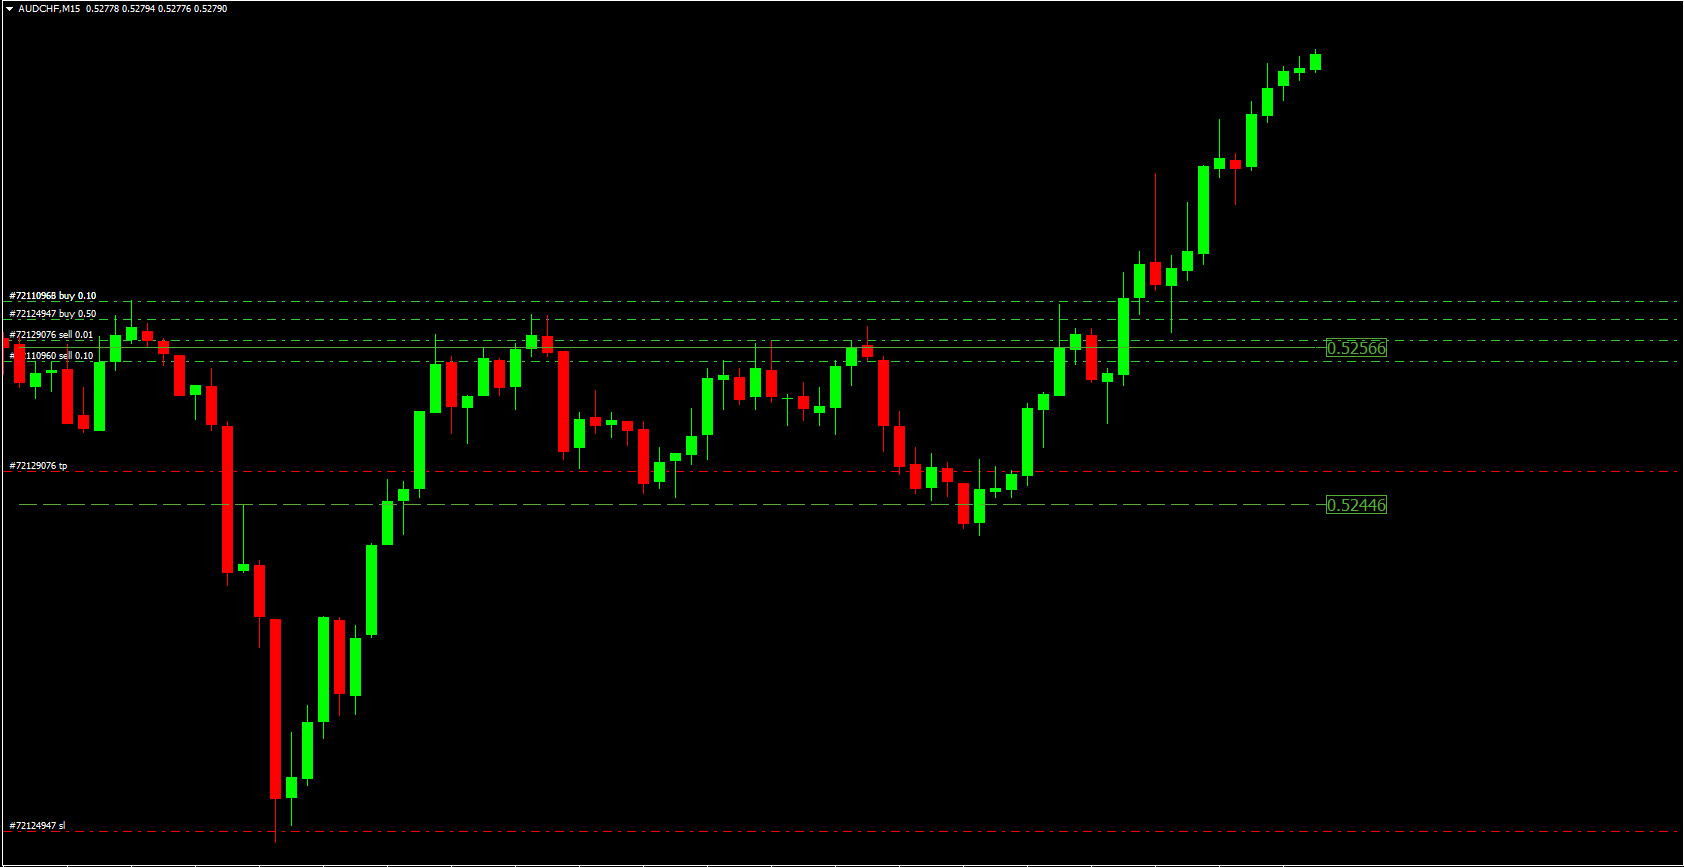
Once applied to your MT4 chart, the Common SR Indicator marks the previous high and low zones of the selected timeframe (daily, weekly, or monthly). These are visually represented as horizontal lines or zones, helping traders instantly spot key areas of interest.
Executing Sell Trades (Resistance Zones)
When price approaches a previous high, it may act as a resistance level. Look for bearish confirmation signals, such as:
Price rejection wicks at the resistance.
Bearish candlestick patterns (e.g., inverted hammer, bearish engulfing).
Momentum indicators (like RSI) showing overbought conditions.
Once confirmed, traders can:
Enter a sell/short position.
Place a stop-loss above the resistance zone.
Take profit at the nearest support level.
Executing Buy Trades (Support Zones)
When price revisits a previous low, it may serve as a support area. Wait for bullish signals such as:
Multiple rejections from the same level.
Bullish reversal candles (e.g., hammer, morning star).
Volume confirmation or divergence on oscillators.
Then, enter a buy/long trade, with your stop-loss below the support and take profit at the next resistance level.
Multi-Timeframe Strategy
Scalpers: Set the indicator to the previous day’s highs/lows for quick trades.
Day and Swing Traders: Use weekly or monthly levels to capture broader market reversals.
This approach ensures you trade within the dominant market structure while aligning with your trading timeframe.
Benefits of the Common SR Indicator for MT4
Automatic Detection: Saves time by automatically identifying major highs and lows.
Dynamic Adaptation: Adjusts to various timeframes (daily, weekly, monthly).
Clear Trade Zones: Makes it easy to spot high-probability entry and exit points.
Works with Any Strategy: Complements trend trading, Scalping, and price action.
Supports Multiple Assets: Use it for Forex, commodities, indices, and crypto.
Example: Price Reaction on EUR/USD
In the EUR/USD H1 chart, the indicator highlights the previous day’s highs and lows. On a lower M15 chart, the price rejects the previous high multiple times — confirming a strong resistance. Traders could open a short trade with a stop-loss slightly above that level.
This same logic applies to support zones: when price rejects a previous low, it signals potential for a bullish reversal.
Conclusion
The Common SR Indicator for MT4 is one of the best tools for identifying and trading support and resistance levels effectively. It simplifies technical analysis by highlighting the exact areas where price reversals, breakouts, or consolidations are most likely to occur.
Whether you’re new to trading or an experienced market analyst, this indicator helps you build a structured and disciplined trading approach.
👉 Download the Common SR Indicator for MT4 for free at IndicatorForest.com and start trading confidently with clear, data-backed support and resistance levels.
FAQ
The Common SR Indicator automatically identifies and highlights previous high and low zones of the selected timeframe (daily, weekly, or monthly). These zones often act as significant support and resistance levels where price may react strongly, making them ideal for strategic trade placement.
When price approaches a previous high, it may act as resistance - look for bearish confirmation signals and consider sell trades. When price approaches a previous low, it may serve as support - look for bullish signals and consider buy trades. These levels are where price reversals, breakouts, or consolidations are most likely to occur.
The indicator automatically detects major highs and lows, saving time and reducing subjective analysis. It adjusts dynamically to various timeframes (daily, weekly, monthly) and makes it easy to spot high-probability entry and exit points without manually drawing levels.
Wait for price rejection wicks, candlestick patterns (like hammers or engulfing patterns), or momentum indicators showing overbought/oversold conditions at these levels. Multiple rejections from the same level provide stronger confirmation for potential reversals or breakouts.
Scalpers can set the indicator to previous day's highs/lows for quick trades. Day and swing traders can use weekly or monthly levels to capture broader market reversals. The indicator adapts to various timeframes, ensuring you trade within the dominant market structure.
1 Download
Published:
Nov 05, 2025 12:43 PM
Category: