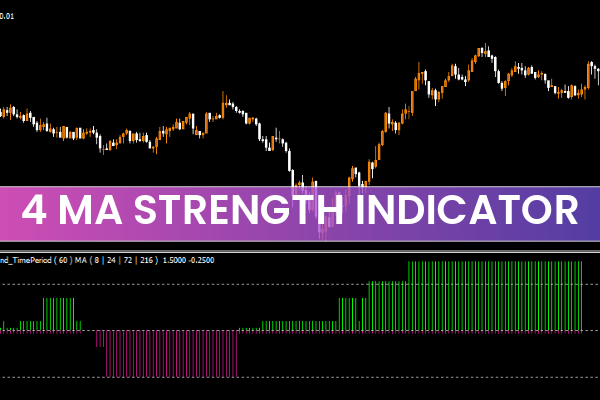
The 4-MA Strength Indicator for MT4 is a straightforward yet effective trend-identification tool that uses the power of four moving averages to determine the market’s direction. Instead of plotting moving average lines on the main chart, it displays color-coded histogram bars in a separate window, allowing traders to instantly recognize whether the market is bullish or bearish.
By combining multiple moving averages (MAs) with varying periods, the indicator filters out noise and helps identify strong market trends and potential reversals. This makes it suitable for traders who prefer a clean chart while still benefiting from moving average-based analysis.
How the 4-MA Strength Indicator Works
The 4-MA Strength Indicator calculates the relationship among four different moving averages to measure the current trend’s strength and direction.
Here’s how it displays the results:
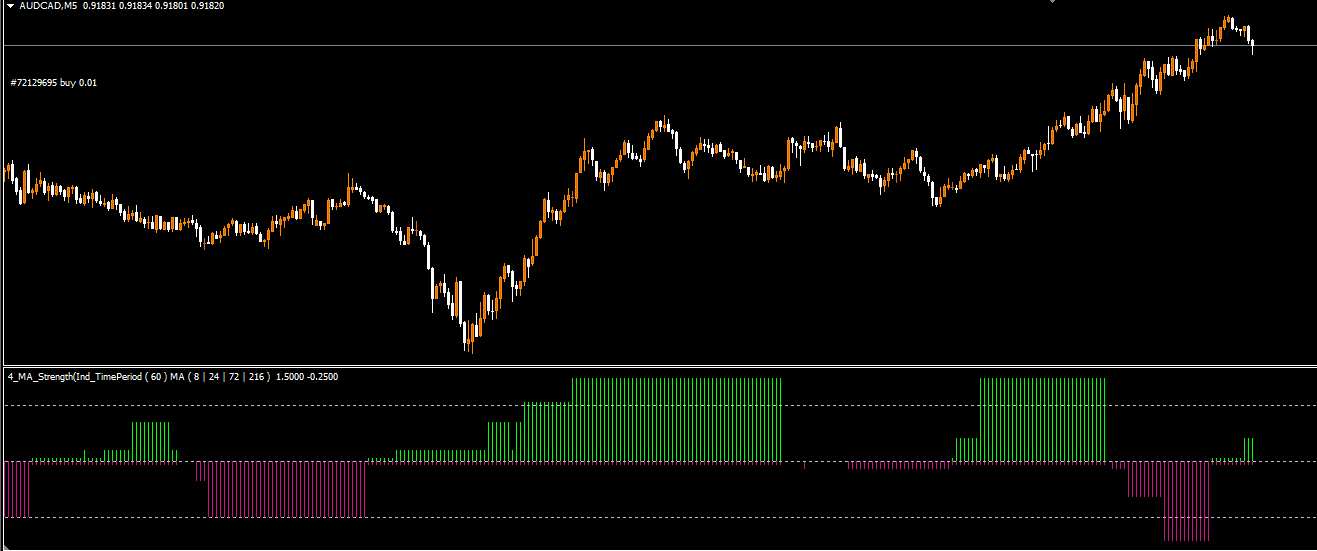
Green Bars: Indicate a bullish trend, suggesting buy opportunities.
Red Bars: Indicate a bearish trend, signaling sell opportunities.
The histogram forms below the main price chart, providing a clear visual guide without cluttering your workspace. Because the indicator doesn’t plot the MA lines themselves, traders can easily monitor the strength and duration of the trend without distraction.
4-MA Strength Indicator BUY/SELL Signals
The above GBP/USD H4 chart shows how the 4-MA Strength Indicator generates simple yet powerful buy and sell signals.
BUY Signal:
The histogram changes from red to green, indicating a shift from bearish to bullish momentum.
Traders can enter a long position once the green bars appear and the price confirms upward movement.
A stop loss can be placed below the most recent swing low to manage risk.
SELL Signal:
The histogram turns red, showing that the trend has turned bearish.
Traders can open short positions when red bars appear and price confirms downward direction.
A stop loss can be set above the last swing high.
Exit Strategy:
Traders can exit their positions when the indicator changes color — for example, closing buy trades when red bars appear or closing sell trades when green bars appear.
This simple approach helps traders capture profits during trending conditions while avoiding reversals.
Best Timeframes and Market Conditions
The 4-MA Strength Indicator performs best on higher timeframes such as H4, Daily, or Weekly charts. This is because short-term noise and false signals are more common on lower timeframes (like M5 or M15).
Recommended Timeframes: H4, D1
Market Types: Forex, Commodities, Indices, and Cryptocurrencies
Trading Style: Swing or position trading
For scalpers or intraday traders, it’s advisable to use the indicator as a trend filter on higher timeframes and then look for precise entries on lower charts.
How to Improve Accuracy with the 4-MA Strength Indicator
While the indicator is effective on its own, combining it with other technical tools increases its accuracy:
Moving Averages (MA): Use a standard MA on the chart to confirm trend direction visually.
Relative Strength Index (RSI): Combine it with RSI to confirm overbought/oversold conditions before entering trades.
Price Action: Look for candlestick patterns (like engulfing or pin bars) when the color changes to validate entry signals.
Using confluence from multiple indicators and chart patterns reduces false entries and improves trade reliability.
Trading Strategy Example
Here’s a simple example of how to trade using the 4-MA Strength Indicator:
Identify the Trend: Check the histogram color on the H4 chart.
Green = Uptrend → look for buy setups.
Red = Downtrend → look for sell setups.
Confirm the Signal: Use RSI or MA crossover for confirmation.
Enter the Trade: Take a position in the direction of the indicator’s signal.
Set Stop Loss and Take Profit: Place stop loss near recent swing points and aim for a 1:2 or higher risk-reward ratio.
Exit: Close the trade when the indicator color changes.
This combination of simplicity and accuracy makes the 4-MA Strength Indicator ideal for traders who prefer visual, data-driven setups.
Advantages of the 4-MA Strength Indicator
Simple and clear visual signals – no need to interpret complex data.
Filters out short-term noise by using multiple moving averages.
Perfect for trend-following and reversal detection.
Works on all financial instruments.
Free to download and easy to install on MT4.
Conclusion
The 4-MA Strength Indicator for MT4 is a clean and efficient trend-detection tool that combines the insights of four moving averages into an easy-to-read histogram. Green and red bars help traders instantly identify bullish or bearish trends and make timely trading decisions.
While it can generate false signals in volatile, low-timeframe markets, pairing it with supporting indicators like RSI or MA crossovers can significantly improve accuracy.
Whether you’re a beginner learning to identify trends or an advanced trader seeking a clear trend filter, the 4-MA Strength Indicator is a valuable addition to your MT4 toolkit — and it’s completely free to download.
FAQ
The 4 MA Strength Indicator displays four moving averages of different periods, helping traders identify trend direction and strength. The interaction between these moving averages reveals whether the trend is strong, weakening, or potentially reversing, providing deeper insight into market structure.
When all four moving averages are aligned in the same direction (ascending for uptrend, descending for downtrend), it indicates a strong trend. When the averages begin to converge or cross, it may signal trend weakening or potential reversal. The spacing between averages shows trend strength.
By showing multiple moving averages simultaneously, the indicator provides a comprehensive view of trend structure across different timeframes. This helps traders understand whether short-term, medium-term, and long-term trends are aligned, improving trade timing and accuracy.
Trade in the direction of the aligned moving averages, using pullbacks toward the averages as potential entry zones. Avoid counter-trend trades when all averages are strongly aligned. Combine with price action patterns or support/resistance levels for confirmation.
The indicator works on all timeframes, but many traders prefer using it on H1, H4, and Daily charts where moving average structures are clearer and more meaningful. Higher timeframes show major trend structure, while lower timeframes can help fine-tune entries.
4 Downloads
Published:
Nov 05, 2025 12:54 PM
Category: