The Change Percentage Indicator for MT4 is a practical tool for traders who want to monitor how quickly prices are rising or falling. Instead of relying only on candlesticks or standard oscillators, this indicator provides a clear percentage-based view of price changes over a set period. By visualizing these changes as colored bars, traders can instantly spot bullish or bearish momentum, assess volatility, and improve timing on trade entries and exits.
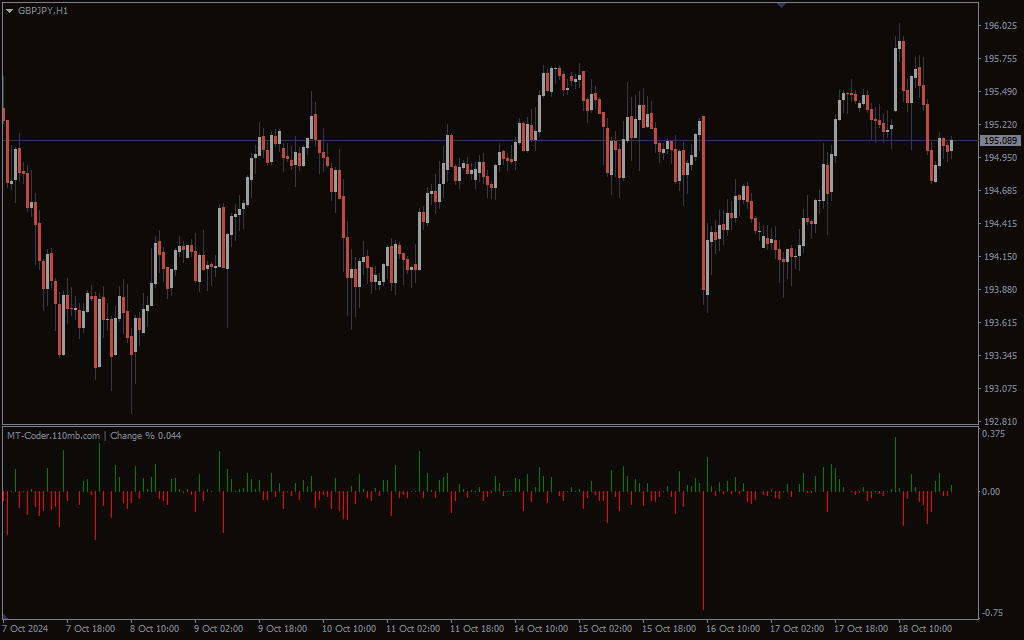
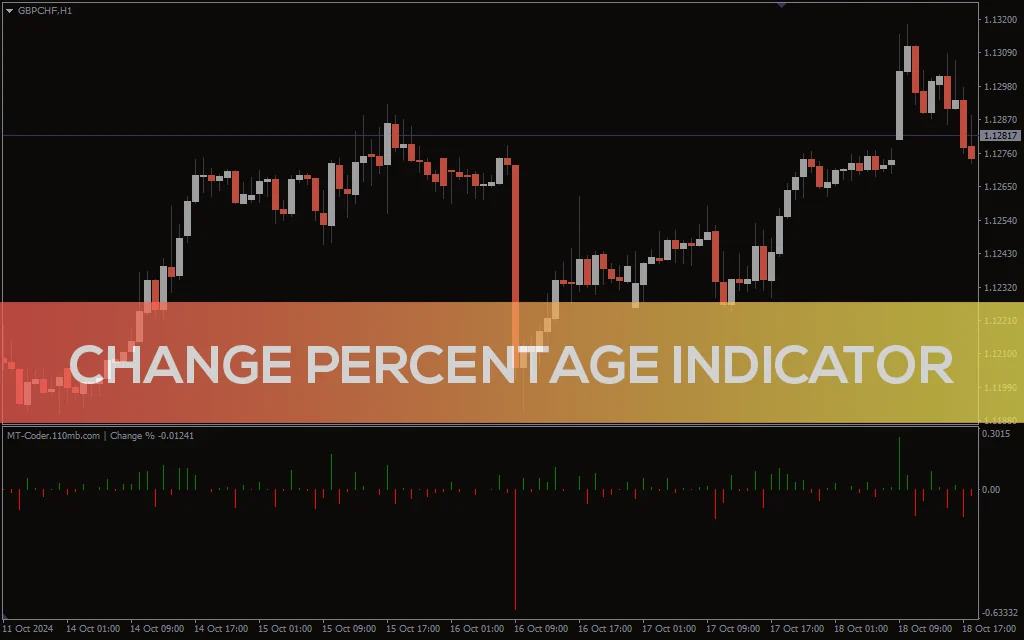
At its core, the Change Percentage Indicator measures the percentage difference in price between the current bar and a past bar, depending on the settings. This data is then displayed as a bar chart on the screen:
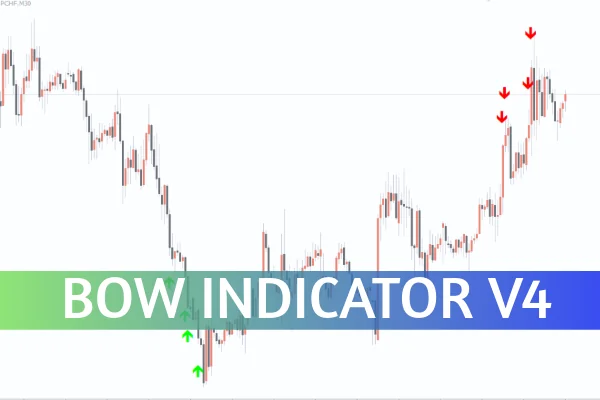
Green Bars → Positive percentage change, signaling upward momentum.
Red Bars → Negative percentage change, signaling downward momentum.
Because it’s based on percentage movement rather than absolute price, the indicator is versatile across forex, stocks, indices, and commodities. Whether you’re day trading or swing trading, it adjusts dynamically to the chosen timeframe.
By quantifying price changes in percentages, traders can confirm whether a move is strong enough to consider a trade. For example, several consecutive large green bars confirm bullish momentum, while a series of red bars highlights persistent selling pressure.
Scalpers may use it on the 1-minute or 5-minute charts to spot rapid intraday shifts, while swing traders can apply it on the daily chart to measure longer-term trends. The ability to compare momentum across timeframes makes it a flexible addition to any strategy.
Instead of cluttering your chart with complex overlays, the Change Percentage Indicator offers a straightforward bar display. This minimalist approach reduces noise and allows traders to focus on actionable signals.
Green Bars: Indicate bullish percentage growth, suggesting a potential buy signal.
Red Bars: Indicate bearish percentage change, suggesting a potential sell signal.
For best results, traders often use the Change Percentage Indicator alongside:
Moving Averages – to confirm trend direction.
Support and Resistance Levels – to identify confluence zones.
Volume Indicators – to validate whether momentum is supported by participation.
For example, if the Change Percentage Indicator shows consecutive green bars while the price also breaks above a resistance level, this confluence may strengthen the case for a long entry.
Unlike traditional momentum indicators that require interpretation, this tool shows market momentum in percentage terms that are easy to understand. It doesn’t matter if you are new to trading or an advanced analyst—its simplicity makes it accessible for all levels.
Additionally, it adapts seamlessly to different asset classes, making it a valuable choice for traders who diversify across forex, crypto, and equities.
The Change Percentage Indicator for MT4 is more than just a technical tool—it’s a decision-support system that helps traders assess volatility, confirm trend strength, and identify trading opportunities with greater confidence.
If you’re ready to upgrade your trading toolkit, explore more powerful indicators and resources at IndicatorForest.com.
Published:
Oct 03, 2025 15:18 PM
Category: