Master the Market Pulse with the Weekly Pivot Indicator
In the high-stakes world of Forex and CFD trading, professional traders don't rely on guesswork—they rely on objective price levels that the "smart money" watches. Among the most powerful tools for identifying these hidden battlegrounds is the Weekly Pivot Indicator. By calculating the equilibrium of the previous week’s Price Action, this indicator provides a roadmap for the week ahead, allowing you to anticipate market turns before they happen.
Download Weekly Pivot Indicator for free. Gain an institutional edge with automated Support And Resistance levels for precise Forex market timing.
What is the Weekly Pivot Indicator?
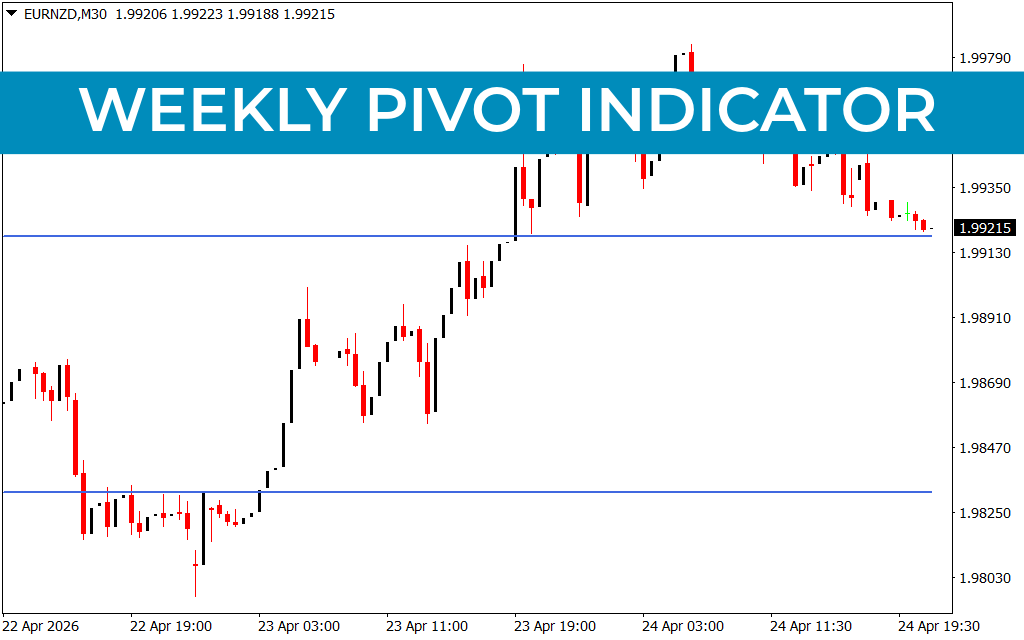
The Weekly Pivot Indicator is a technical analysis tool that automatically calculates and plots significant price levels based on the high, low, and close of the preceding trading week. The central "Pivot Point" serves as the primary balance line. When price is trading above the weekly pivot, the market sentiment is considered bullish; when below, it is bearish.
As demonstrated in the EURNZD M30 chart, these levels appear as clean, horizontal lines that the market frequently respects. These aren't just random lines on a screen; they represent psychological benchmarks where institutional liquidity often resides.
The Anatomy of Pivot Levels
A standard Weekly Pivot setup includes the central pivot (PP) and several layers of support and resistance:
- Resistance Levels (R1, R2, R3): These act as "ceilings." If the market is in a strong uptrend, traders look to these levels as potential take-profit targets or areas where a reversal might occur.
- Support Levels (S1, S2, S3): These act as "floors." In a bearish environment, these levels represent high-probability zones for a price bounce or a trend exhaustion.
- The Central Pivot: This is the ultimate "fair value" line. It is common for the market to gravitate back to this level early in the week before deciding on a definitive direction.
Why Every Strategy Needs Weekly Pivots
The primary advantage of the Weekly Pivot Indicator is its objectivity. Unlike subjective trendlines that vary from trader to trader, pivot points are calculated using a fixed formula. This means millions of traders are looking at the exact same levels, creating a self-fulfilling prophecy in price action.
- Contextual Clarity: By looking at the weekly levels on a lower timeframe like the M30 or H1, you can see the "big picture" without losing track of intraday opportunities.
- High-Probability Entries: Trading a "Pivot Bounce"—where price touches a support level and shows a rejection candle—is one of the most reliable setups for swing traders.
- Risk Management: Pivot levels provide logical places for stop-loss orders. If you buy at S1, placing a stop just below S2 gives your trade room to breathe while maintaining a professional risk-to-reward ratio.
- Trend Confirmation: When price breaks through a weekly resistance level with high volume, it confirms a breakout, signaling that the bulls have taken full control of the weekly cycle.
Conclusion
The Weekly Pivot Indicator is an essential framework for any MetaTrader user. It transforms a chaotic chart into an organized field of play, highlighting the prices that actually matter. Whether you are a day trader looking for quick targets or a swing trader holding for the long haul, integrating weekly pivots will bring a new level of institutional precision to your trading desk.
1 Download
Last Update:
Apr 25, 2026 22:47 PM
Published:
Feb 02, 2026 13:23 PM
Category: