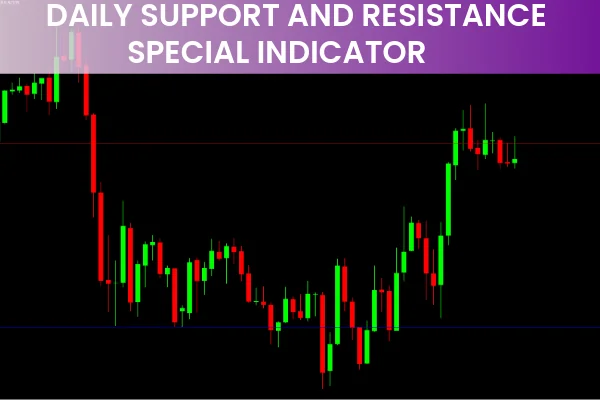
The Daily Support And Resistance Special Indicator for MT4 helps forex traders identify key market zones using the previous day’s open, high, low, and close price levels. By deriving support and resistance from daily data, the indicator provides reliable Market Structure zones that reveal bullish or bearish market conditions. Because the support and resistance levels remain the same across intraday timeframes, traders can apply them on M5, M15, M30, or H1 charts with equal precision.
This simplicity makes the Daily Support and Resistance Special Indicator for MT4 a popular tool among both new and professional traders. It offers only two clean price levels: one support line and one resistance line—making it extremely easy to interpret and apply in real-time trading conditions.
How the Daily Support and Resistance Special Indicator Works
The indicator uses data from the previous daily candle to determine the most significant support and resistance levels. These levels act as the foundation for both breakout and reversal strategies.
Indicator Display
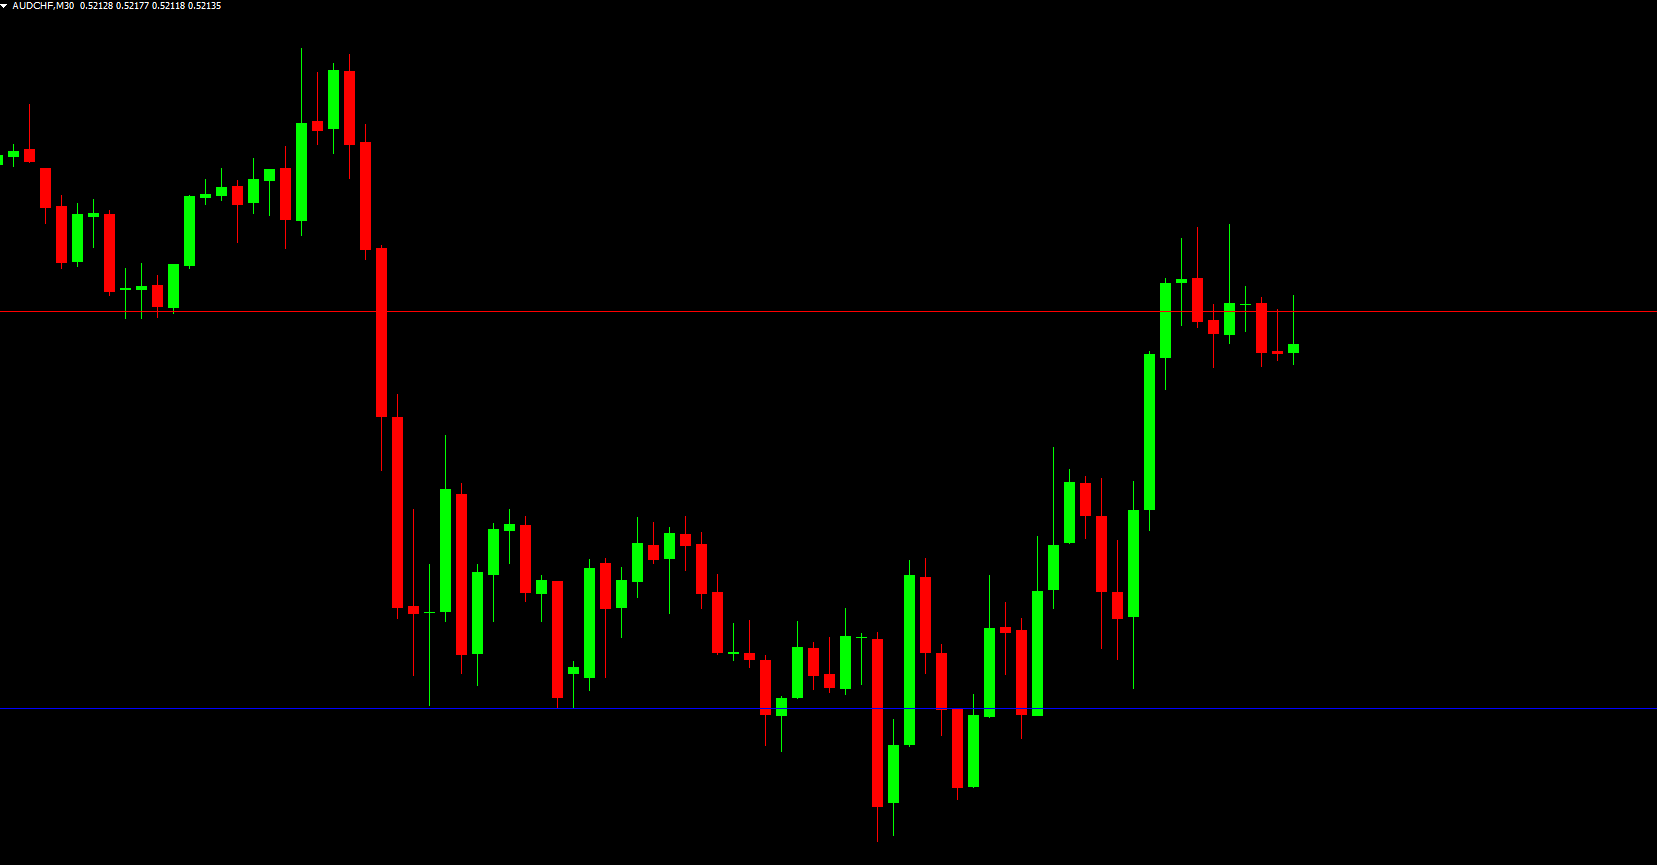
Red Line → Resistance
Blue Line → Support
These lines appear on all intraday charts and remain fixed throughout the day until new daily OHLC data is processed.
Why the Indicator Works on All Intraday Timeframes
Even though the calculation is based on the daily timeframe, the plotted levels automatically adapt to lower timeframes. This allows traders to:
Spot intraday breakouts
Detect reversal zones
Identify key areas where price may stall or accelerate
The indicator is especially effective for scalpers and intraday traders who rely on clean chart structures.
Benefits of Using the Daily Support and Resistance Special Indicator
Clean and Simple Signals
With only one support and one resistance line, traders avoid clutter and confusion. This makes the indicator perfect for beginners looking for clarity.
Ideal for Breakout Trading
If price rises above the red resistance line, it indicates bullish momentum. If it falls below the blue support line, it signals bearish movement.
Strong Reversal Zones
These levels often act as institutional price barriers. Combined with candlestick signals, they can pinpoint high-probability reversal setups.
Works with Any Trading Strategy
Advanced traders often integrate this indicator with:
RSI
MACD
Trend indicators
Support/resistance confluence zones
This enhances accuracy and confirms whether a breakout or reversal is strong.
Easy to Install and Free to Download
The indicator is lightweight, quick to load, and available as a free MT4 tool—making it accessible for all traders.
How to Trade Using the Daily Support and Resistance Special Indicator
Buy Setup
A bullish condition occurs when price breaks above the red resistance line.
Trading plan:
Enter Buy when price closes above resistance
Place stop loss below the previous swing low
Exit using a favorable risk to reward ratio or when weakness appears
Sell Setup
A bearish condition occurs when price breaks below the blue support line.
Trading plan:
Enter Sell when price breaks below support
Place stop loss above the previous swing high
Exit after a solid RRR or when price starts consolidating
Important Trading Note
The indicator does NOT provide take-profit levels. Traders must rely on:
RRR strategies
Price structure
Market momentum
Additionally, breakout entries are more reliable when confirmed by candlestick patterns, trend direction, and volume behavior.
Best Practices for Using This Indicator
Because the indicator is simple, traders should enhance its effectiveness by adding:
Support/resistance confirmation
Trendline analysis
Volume indicators
Rejection candlesticks (pin bars, engulfing patterns)
Avoid placing limit orders blindly at support or resistance—the market may continue trending or break through the levels sharply.
Conclusion
The Daily Support and Resistance Special Indicator for MT4 provides clean, effective support and resistance zones using the previous day’s price data. While the indicator simplifies market structure, traders should still use price action or technical indicators to confirm reversals or breakouts. Its ease of use, accuracy, and availability as a free download make it an excellent tool for intraday traders.
For more MT4 indicators and professional tools, visit IndicatorForest.com.
FAQ
1 Download
Published:
Nov 23, 2025 01:37 AM
Category: