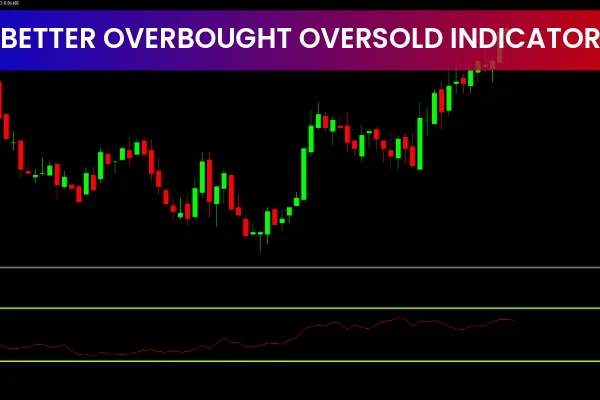
The BOO Indicator, also known as the Better Overbought Oversold indicator, is a simple yet powerful MT4 tool designed to help traders identify market reversal zones. Similar to the RSI, the BOO indicator oscillates between 0 and 100. It displays overbought and oversold levels using a moving average line and a signal bar, allowing traders to detect potential BUY and SELL signals quickly and clearly. Because the BOO indicator works on all timeframes, it offers great flexibility for forex traders aiming to improve their market timing.
How the BOO Indicator Works
The BOO indicator operates much like a classic oscillator. It identifies potential reversal points when its moving average line surpasses key thresholds:
Above 70 → Overbought zone (possible SELL setup)
Below 30 → Oversold zone (possible BUY setup)
These levels help traders confirm when a trend may be weakening or ready to reverse. The indicator also features colored bars that visually highlight the overbought and oversold conditions, making it easier to interpret at a glance.
BOO Indicator BUY/SELL Signals Explained
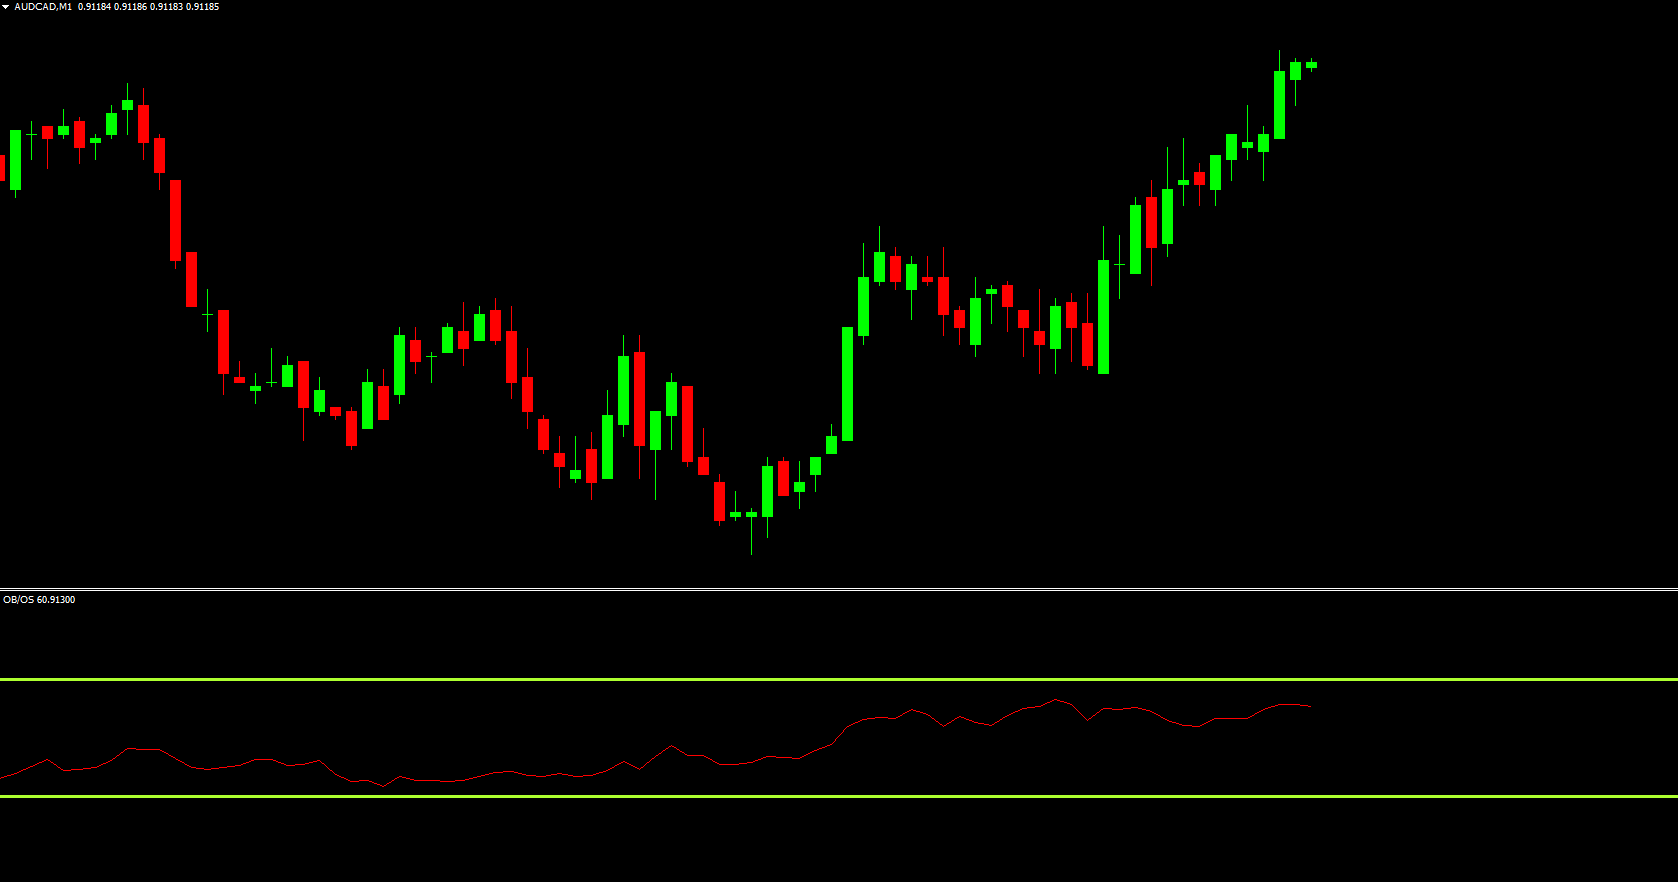
When applied on a chart, such as GBP/USD H4, the BOO indicator marks BUY or SELL signals according to its oscillator values:
When price moves upward and the BOO value rises above 70, the market enters an overbought condition. This is a warning that prices may reverse downward soon.
When price drops and the BOO value falls below 30, the market becomes oversold. Traders can prepare for potential BUY entries or exit short positions.
Because of its design, the BOO indicator helps identify early momentum exhaustion, allowing traders to react before a major reversal unfolds.
Best Timeframes for the BOO Indicator
Although the BOO indicator works on all timeframes, it performs best on higher timeframes such as the daily or weekly chart. These longer timeframes reduce noise and minimize false signals. For Scalping or intraday trading, the indicator might generate more misleading signals due to short-term volatility.
To improve accuracy, many traders combine BOO with tools like MACD, RSI, or moving averages to confirm trends and avoid premature entries.
Frequently Asked Questions
Which indicator is best for overbought and oversold analysis?
There is no single “best” indicator because each trader's strategy is different. Popular options include RSI, Stochastics, CCI, and the BOO Indicator. The key is testing which tool aligns with your trading system.
What does overbought or oversold mean?
Oversold (below 30): The market may be ending its downtrend and preparing for an upward reversal.
Overbought (above 70): The market may be losing bullish momentum and preparing for a downward correction.
These conditions help traders detect potential turning points and optimize trade entries and exits.
Conclusion
The BOO Indicator is a helpful MT4 tool that simplifies the identification of overbought and oversold areas, highlighting clear BUY and SELL opportunities. Its visual bars and moving average signals give traders precise entry and exit points, especially on longer timeframes. Since it’s free and easy to install, it's an excellent addition to any trader’s technical toolbox.
To get the most out of this indicator and explore many more powerful trading tools, visit IndicatorForest.com today.
FAQ
1 Download
Published:
Nov 17, 2025 20:50 PM
Category: