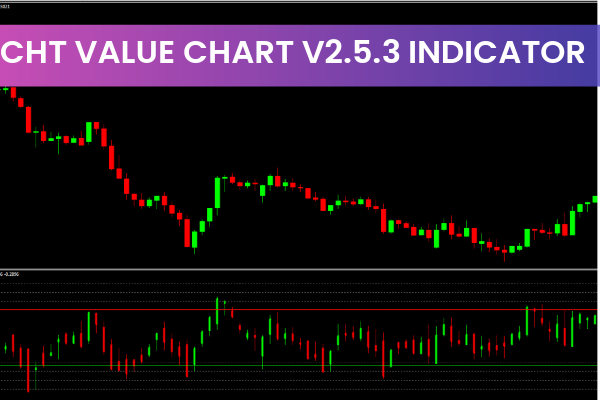
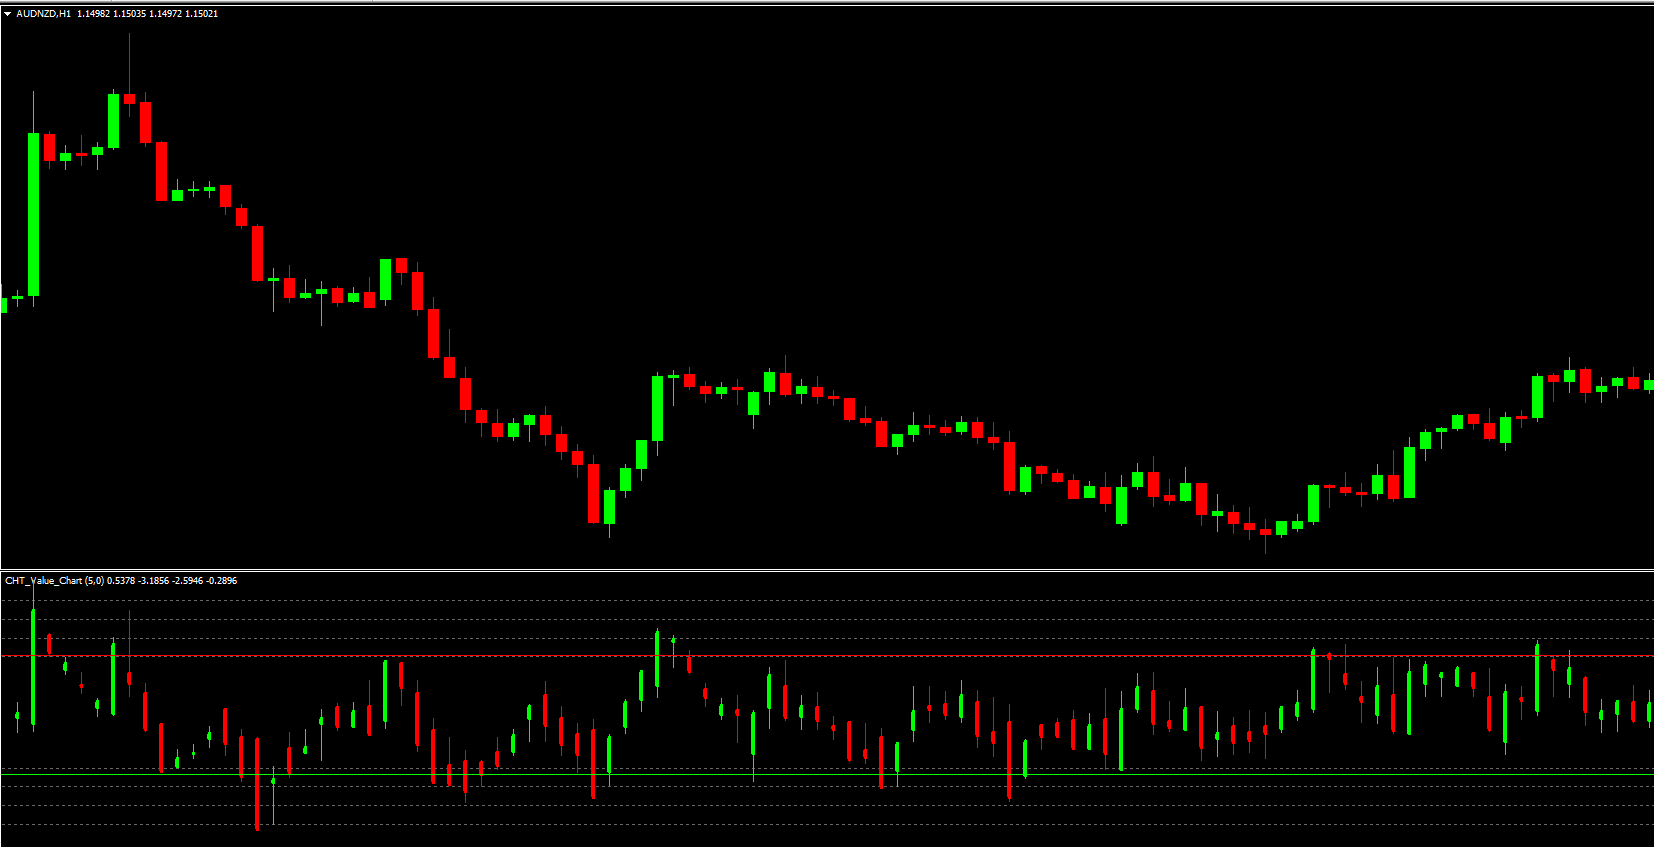
The CHT Value Chart V2.5.3 indicator for MT4 is a powerful custom oscillator that plots a value chart in a separate window. It displays green and red candles, along with clearly defined overbought and oversold levels. When the value chart touches these levels, forex traders can anticipate potential price reversals and identify ideal entry points for buy or sell trades.
Designed to be intuitive and visually clear, the CHT Value Chart V2.5.3 indicator suits both beginner and advanced traders. New traders benefit from understanding overbought/oversold price behavior and using Price Action for confirmation. More experienced traders can combine this tool with additional indicators to refine entries and build advanced confluence-based strategies.
The indicator performs well on all intraday timeframes and higher timeframes such as daily, weekly, and monthly charts. It can be downloaded and installed easily, making it a popular option for traders seeking reversal-based tools.
Key Features and Benefits
Visual Candle-Based Oscillator
Instead of using the traditional line-based oscillator, this indicator plots green candles for bullish pressure and red candles for bearish pressure within its value chart. This visual structure helps traders quickly spot momentum shifts.
Overbought and Oversold Levels
Green Line = Oversold Level
Red Line = Overbought Level
These boundaries act as a reference for identifying when the market may be overstretched and ready to reverse.
Suitable for All Trading Styles
Scalpers, day traders, and swing traders can use the indicator effectively. Its signals appear consistently across major timeframes, offering flexibility for various trading strategies.
How the CHT Value Chart V2.5.3 Indicator Works
The indicator measures price deviations from a normalized value range.
When candles touch the oversold (green) level, it indicates a potential end of bearish momentum.
When candles hit the overbought (red) level, it warns that bullish momentum may be weakening.
These signals highlight zones where price is likely to reverse or retrace.
However, the indicator does not provide take-profit targets. Traders must rely on price structure, risk-reward planning, or trailing stops to exit trades effectively.
Trading Signals: How to Use the CHT Value Chart V2.5.3
Buy Trade Setup
Watch for value chart candles to hit the oversold green line.
Confirm the potential reversal using price action such as bullish engulfing patterns, pin bars, or trendline breaks.
Enter a BUY trade.
Place the stop loss below the previous swing low.
Plan profits using a minimum 1:2 risk-to-reward ratio or a technical target such as a resistance zone.
Sell Trade Setup
Observe when candles touch the overbought red line.
Validate the bearish reversal using price action signals like bearish engulfing, double tops, or support breaks.
Enter a SELL trade.
Place the stop loss above the previous swing high.
Manage profits using clear levels or trailing stops.
Best Practices for Accurate Signals
Never rely solely on the overbought/oversold levels.
Confirm signals using trend indicators, moving averages, or support/resistance.
Avoid trading during low-volatility market sessions when oscillators may produce weaker signals.
Combine higher timeframe trend direction with lower timeframe entries.
Why This Indicator Enhances Trading Accuracy
The CHT Value Chart V2.5.3 indicator enhances accuracy by helping traders avoid false reversals and identify true exhaustion zones. Its candle-style plotting gives a clearer view of momentum strength compared to line-based oscillators. When used within a confluence-based strategy, it becomes an effective tool for timing market reversals with higher probability.
Conclusion
The CHT Value Chart V2.5.3 indicator for MT4 is an efficient oscillator that helps traders identify overbought and oversold market conditions. While it can be used similarly to other reversal-based indicators, the best results come from confirming its signals with price action or complementary indicators. Its ease of use, multi-timeframe compatibility, and free availability make it a valuable addition to any forex trader’s toolkit.
Discover more trading tools and premium indicators at IndicatorForest.com.
FAQ
4 Downloads
Published:
Nov 22, 2025 13:56 PM
Category: