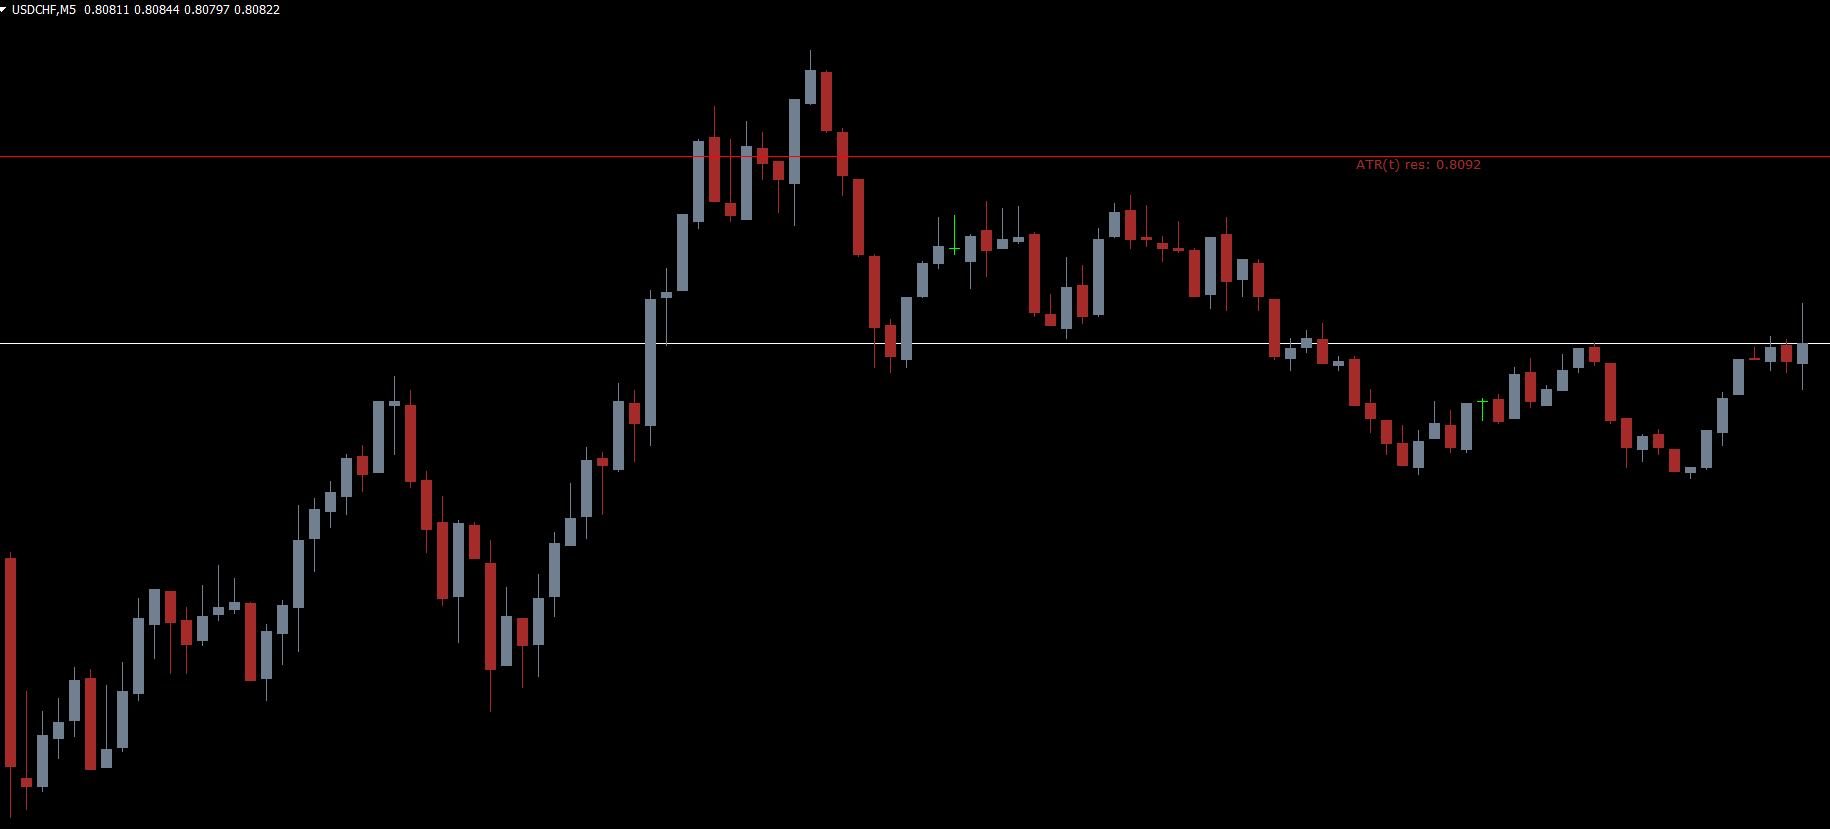
he ATR Levels Indicator for MT4 is a powerful technical analysis tool designed to help forex traders identify trend direction, volatility zones, and potential reversal points. Unlike the traditional Average True Range (ATR), which plots a single volatility line below the chart, the ATR Levels Indicator automatically draws two support and two resistance levels directly on the price chart. These levels make it easier to determine whether the market is preparing for a breakout, continuation, or reversal.
By using ATR-derived Support And Resistance, traders gain clearer insights into where price may react, making it an excellent tool for both new and advanced forex traders. The ATR Levels Indicator works on all timeframes, but its accuracy increases significantly on higher timeframes such as H1, H4, and Daily charts, where false signals are minimized.
How the ATR Levels Indicator Works
The indicator generates four key levels:
ATR(y) Resistance (Upper)
ATR(t) Resistance (Lower)
ATR(y) Support (First Support)
ATR(t) Support (Second Support)
These levels act as dynamic price boundaries. When the market tests or breaks these boundaries, traders can identify trend behavior, volatility strength, and potential trading opportunities.
ATR Levels Indicator BUY/SELL Signals
When to Enter SELL Trades
The example GBP/USD chart shows how the ATR Levels Indicator identifies bearish conditions. When the price closes above the upper resistance levels, it indicates strong downward momentum. This situation suggests:
A losing strength in the bullish move
A potential reversal to the downside
An opportunity to enter SELL trades
A good point to exit previous BUY trades
Traders can set stop-loss levels above the broken resistance zone and look for continuation patterns to ride the downtrend effectively.
When to Enter BUY Trades
BUY signals appear when the market approaches or touches the first support level. When price moves near this zone, the indicator suggests that bullish momentum may follow, particularly if Price Action confirms it.
Traders should:
Look for bullish candlestick patterns
Confirm the uptrend continuation
Place BUY trades with stop-loss below the second support zone
This allows traders to take advantage of early trend reversals or continuation patterns after corrections.
Improving Accuracy with Additional Indicators
While the ATR Levels Indicator performs well on its own, combining it with other technical tools improves signal accuracy. Popular choices include:
RSI (Relative Strength Index) for overbought/oversold confirmation
MACD for momentum verification
Moving Averages to align with overall trend direction
Price Action Patterns like engulfing candles, pin bars, and breakouts
These combinations create a more robust and reliable trading strategy.
Best Timeframes and Trading Tips
Works best on H1, H4, and Daily charts
Avoid using it alone on volatile low timeframes such as M1 or M5
Ideal for swing traders and intraday traders who rely on trend structure
Always confirm signals with at least one additional technical tool
Proper risk management is essential. Use stop-loss levels based on ATR support and resistance to protect your positions.
Conclusion
The ATR Levels Indicator for MT4 is a valuable tool for identifying trend direction, market volatility, and key support and resistance levels. Its multi-level structure allows traders to locate early entries and potential reversal points with confidence. You can download the ATR Levels Indicator for free from our website and start enhancing your trading strategy today.
👉 Visit IndicatorForest.com to download the indicator and explore more premium MT4 tools.
FAQ
1 Download
Published:
Nov 21, 2025 21:23 PM
Category: