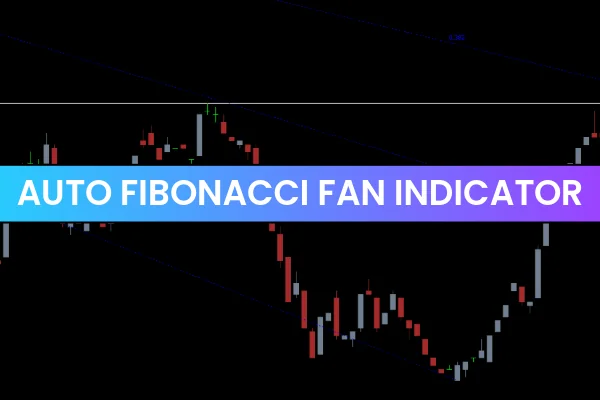
The Auto Fibonacci Fan Indicator for MT4 is a technical tool that automatically plots Fibonacci-based Support And Resistance levels on the chart. It uses key Fibonacci ratios—including 23.6%, 38.2%, 50%, 61.8%, and 80.9%—and converts them into five dynamic lines that help traders analyze price movement.

The indicator draws its lines from significant swing highs or lows and identifies the prevailing market trend. It automatically displays blue lines for bullish trends and red lines for bearish trends, allowing traders to quickly determine when to enter or exit trades. While the indicator can be used on any timeframe, higher timeframes generally produce more reliable signals and help minimize noise.
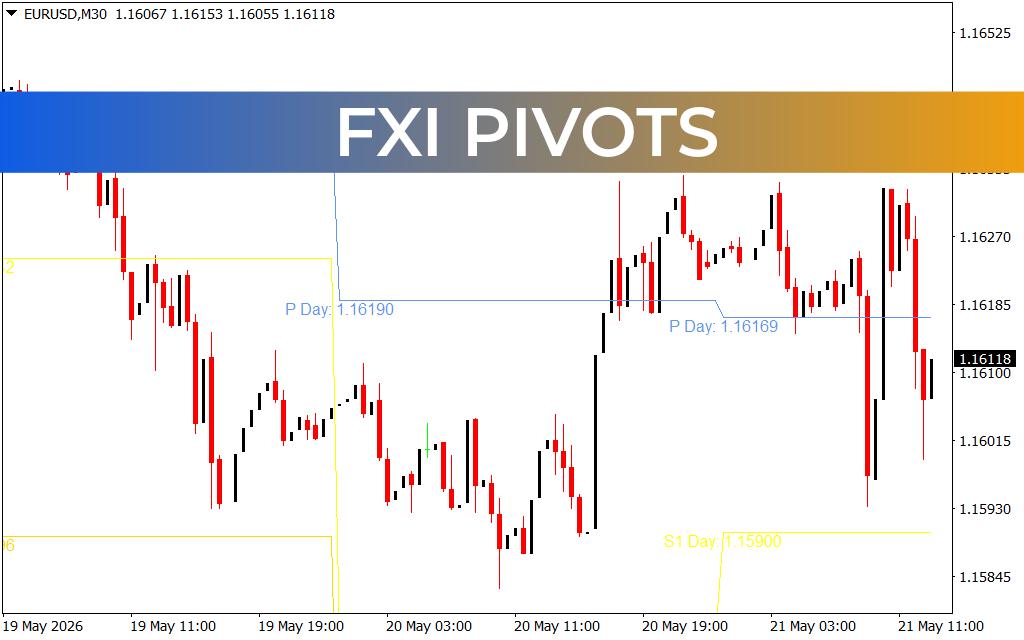
Auto Fibonacci Fan Indicator BUY/SELL Signals
The GBP/USD H4 chart above shows how BUY and SELL signals are generated. To interpret the signals, traders simply follow the color of the plotted lines:
Red lines indicate a downtrend, signaling traders to prepare for short entries or exit long positions. These lines act as descending resistance levels.
Blue lines indicate an uptrend, encouraging traders to look for long entries or close their short positions. These lines act as rising support zones.
For improved accuracy, the Auto Fibonacci Fan Indicator can be combined with additional tools like RSI, MACD, or candlestick patterns for confirmation.
Conclusion
The Auto Fibonacci Fan Indicator automatically draws five Fibonacci-based levels that help traders identify trend direction and potential support or resistance zones. It is simple to use, visually clear, and suitable for traders of all levels.
You can download the Auto Fibonacci Fan Indicator for free from our website.
FAQ
3 Downloads
Published:
Nov 21, 2025 21:11 PM
Category: