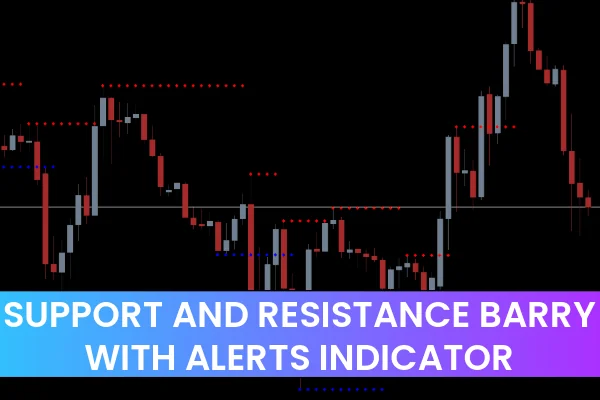
The Support And Resistance Barry With Alerts Indicator for MT4 is a powerful and beginner-friendly trading tool that automatically identifies key support and resistance levels based on previous market structure. These levels act as some of the most reliable decision-making zones in forex trading, allowing traders to pinpoint entry points, place stop losses, and set take profit targets with greater accuracy.
The indicator scans past price movements and marks price zones where the market previously reacted strongly. These reaction points form natural boundaries where price tends to bounce or reverse. Since support and resistance are foundations of technical analysis, this tool becomes extremely useful for new and advanced traders alike.
The indicator works on all timeframes, from 1-minute Scalping to long-term analysis on daily charts. Scalpers can use it for quick intraday decisions, while swing and positional traders can rely on higher timeframe S/R levels for more stable setups. However, traders should note that the indicator repaints the last 3 bars, meaning the newest dots can change until fully confirmed.
How the Support and Resistance Barry Indicator Works
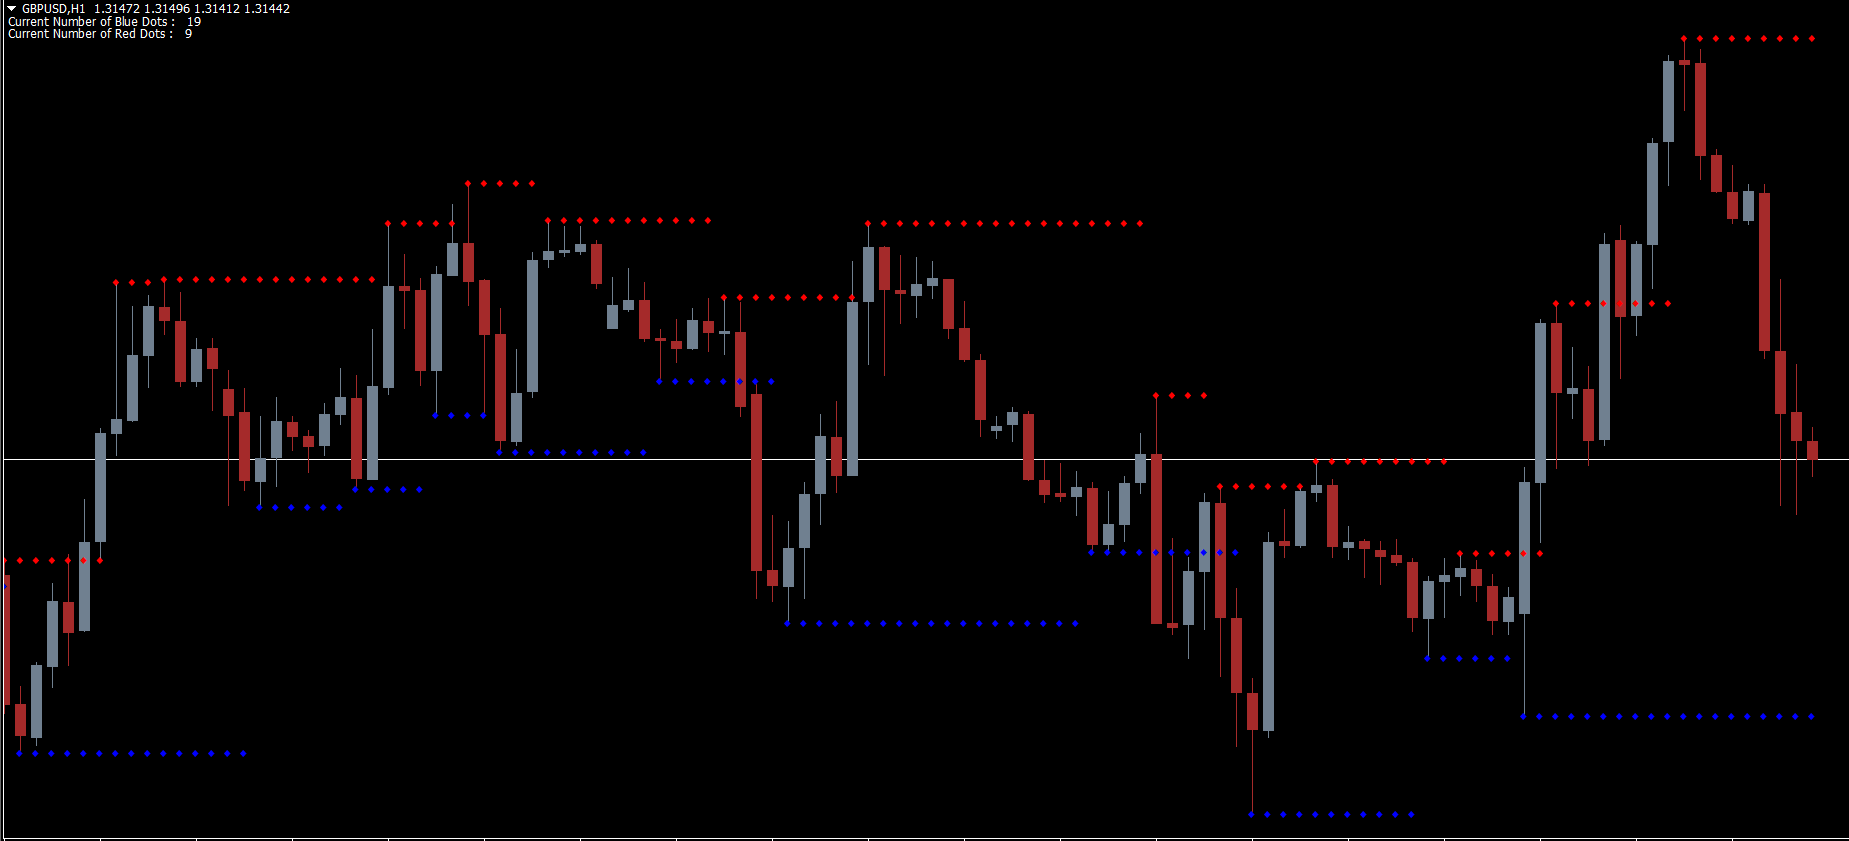
This indicator uses historical highs and lows to identify areas where price has previously halted or reversed. These levels are then marked on the chart using easy-to-read colored dots:
Blue dots – Mark support zones
Red dots – Mark resistance zones
Each time a potential support or resistance area forms, the indicator triggers an alert, notifying traders of a possible trading opportunity.
The repainting behavior works like this:
When the indicator detects new support or resistance, it plots the first dot.
If price continues to confirm the zone, it continues plotting dots.
Only after the 3rd consecutive dot forms, the zone becomes valid.
At that moment, the indicator repaints the previous two candles with the correct color (blue for support, red for resistance).
This is why traders should always wait for 3 consecutive dots before entering a trade.
Support and Resistance Barry Indicator – Trading Signals
The indicator provides two clear and simple trading signals:
Buy Signal
A buy opportunity appears when:
3 blue dots form consecutively
Price respects the support zone
An alert notifies the formation of the level
This indicates strong bullish pressure and increases the probability of an upward move.
Sell Signal
A sell opportunity appears when:
3 red dots appear consecutively
Price confirms the resistance zone
The alert triggers the signal
This shows bearish pressure, signaling a potential reversal or continuation downward.
Since the indicator repaints until confirmation, traders should avoid entering before the 3rd dot. Confirmed levels provide much higher accuracy.
For even stronger setups, combine this indicator with tools like:
Trend Strength Indicator for MT4
Buyers Sellers Dashboard
(insert your internal links above)
Practical Example
Assume you are analyzing GBPUSD on the M15 chart:
Price begins to stall near a known resistance zone.
The indicator prints two red dots as price tests the area.
On the next candle, the third red dot appears—confirming the resistance.
The alert signals a sell opportunity.
You enter a short trade with stop loss slightly above the resistance.
This simple structure allows even novice traders to identify high-quality reversal and continuation setups.
Why Traders Prefer the Barry Support and Resistance Indicator
Here are its key advantages:
Auto-detection of S/R levels
Real-time alerts for new opportunities
Simple color-coded signals
Works on all forex pairs and timeframes
Ideal for both beginners and advanced traders
Can be used for scalping, intraday, and swing trading
Helps improve risk management using natural S/R levels
Conclusion
The Support and Resistance Barry With Alerts Indicator for MT4 is an excellent tool for traders who rely on support and resistance to make precise trading decisions. Its visual clarity, alert system, and automatic detection of key market levels make it highly effective for improving trade timing and risk management.
If you want a simple yet reliable way to identify market turning points, this indicator is a must-have addition to your MT4 toolbox.
FAQ
Published:
Nov 13, 2025 20:46 PM
Category: