The Flat Market Detector Indicator is a unique technical tool designed to help traders identify ranging or flat markets. Trading during a flat market can be risky, so this indicator allows you to stay out during choppy periods and only enter trades when the market expands and prepares for a strong trend.
How the Flat Market Detector Indicator Works
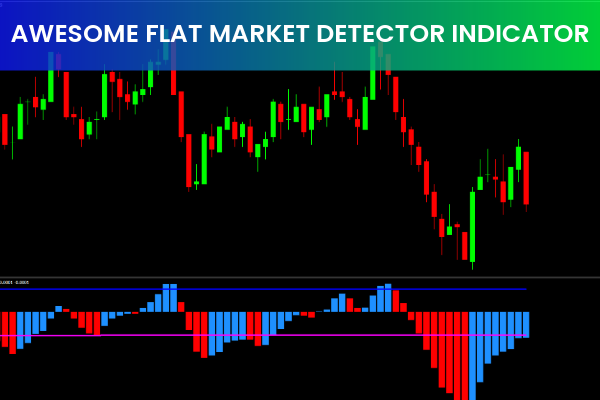
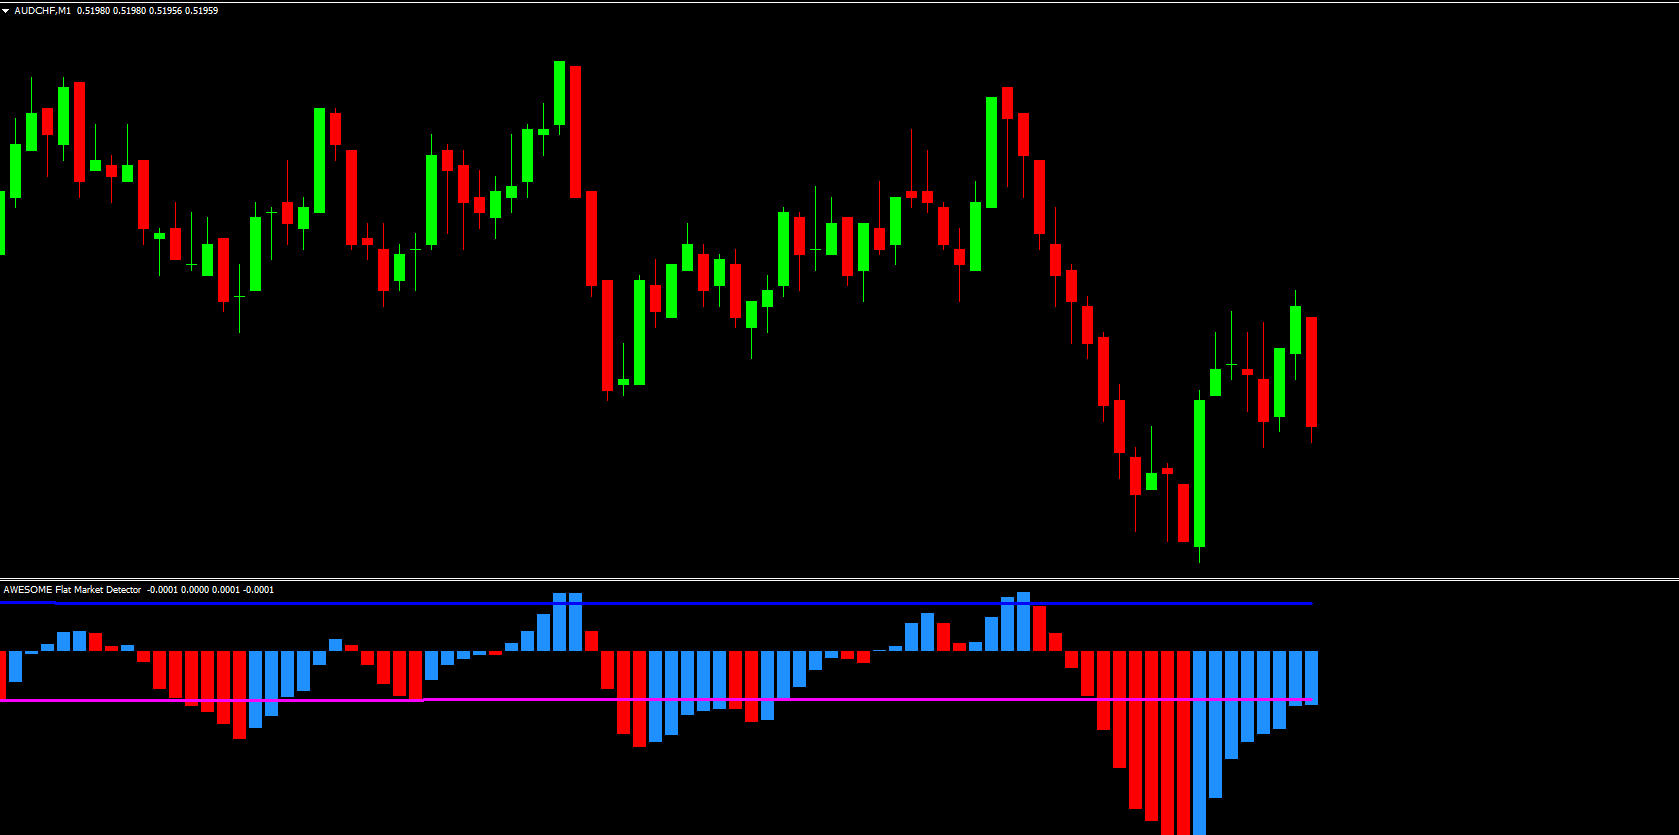
The indicator uses a histogram based on the difference between fast and slow Exponential Moving Averages (EMA). Key features include:
Histogram Bars – Blue bars indicate the current value is higher than the previous bar; red bars indicate the current value is lower.
Threshold Lines – Calculated using Gamma standard deviation of the histogram, these lines indicate flat or trending market conditions.
Momentum Detection – Histogram bars that pierce threshold lines strongly signal increasing momentum and potential strong trends.
Traders can apply the indicator to any instrument on any timeframe, making it highly versatile.
How to Trade Using the Flat Market Detector Indicator
Detecting Flat Markets
When histogram bars stay within the threshold lines, the market is flat or ranging.
Avoid entering trades during this period to reduce the risk of false signals.
Identifying Trend Momentum
Histogram bars breaking through threshold lines signal increasing momentum.
Long red bars indicate a strong downtrend.
Long blue bars indicate a strong uptrend.
Trading Strategy
Combine the Flat Market Detector with range-breakout strategies or Asian range strategies.
Wait for bars to strongly pierce threshold lines before entering trades.
Use other indicators, such as moving averages or support/resistance, for confirmation.
Trading Example
On a EUR/GBP daily chart, the Flat Market Detector shows:
Bars piercing threshold lines indicate strong momentum.
Elongated red bars indicate a downtrend, signaling potential short trades.
Blue bars moving far from the threshold line indicate a bullish trend, signaling long trades.
This visualization helps traders determine when to enter or avoid trades depending on market conditions.
Benefits of the Flat Market Detector Indicator
Clearly identifies flat and ranging markets.
Detects trend momentum using histogram bars and threshold lines.
Works on any timeframe or instrument.
Supports Asian range strategies and breakout trading.
Helps reduce losses during sideways markets by keeping traders out of flat conditions.
Conclusion
The Flat Market Detector Indicator is a unique and essential tool for traders looking to avoid ranging markets and capture strong trends. By analyzing histogram bars against threshold lines, traders can identify flat periods, strong momentum, and trend direction. Integrate this indicator into your strategy to improve entry timing and risk management. Download the Flat Market Detector Indicator for free from IndicatorForest.com to enhance your trading efficiency.
FAQ
12 Downloads
Published:
Nov 19, 2025 12:55 PM
Category: