The Murrey Math Lines Indicator is a powerful MT4 tool that helps traders identify clear Support And Resistance levels using an algorithm based on Murrey Math and principles drawn from W.D. Gann’s famous technical methodologies. By dividing price action into eight mathematically calculated levels, the indicator allows traders to better understand market structure, anticipate reversals, and identify high-probability entry and exit points.
Gann was known for creating some of the most accurate market forecasting methods, including Gann Angles. The Murrey Math concept expands on these ideas by applying consistent mathematical calculations to any chart, timeframe, or asset—making it a versatile tool for forex, indices, stocks, and commodities.
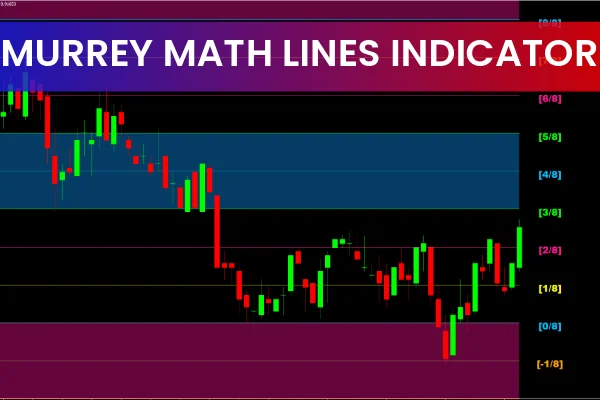
How the Murrey Math Lines Work
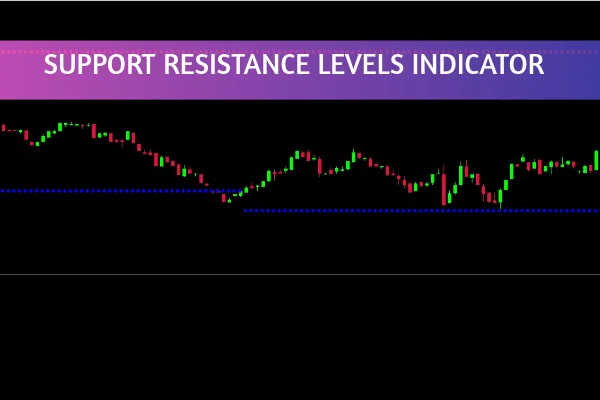
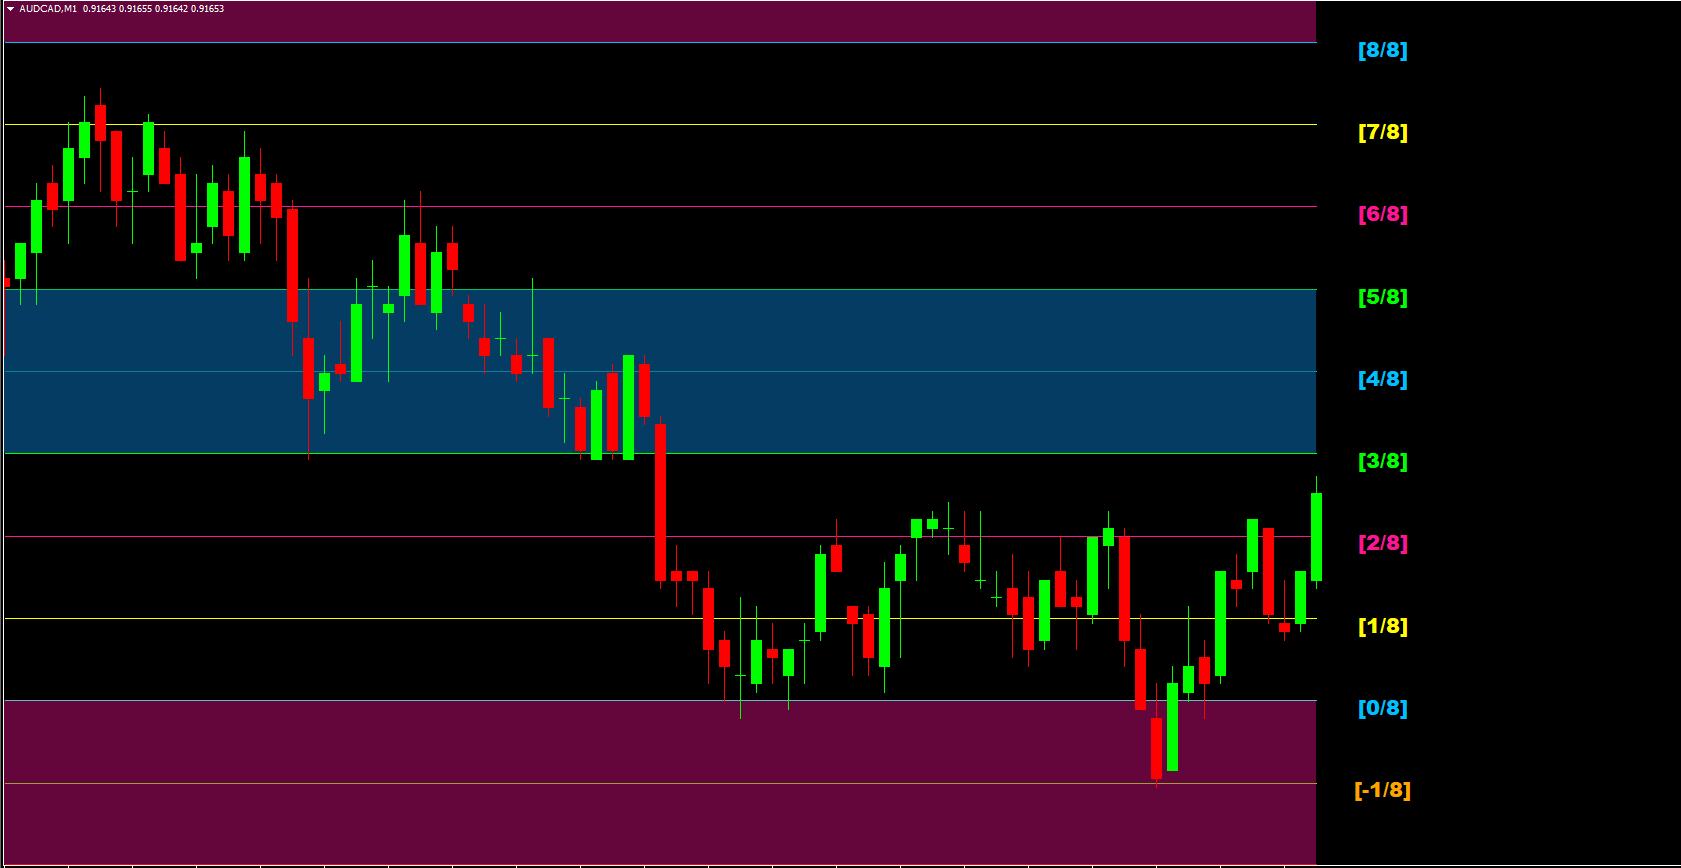
The indicator plots eight horizontal levels, each representing a different type of support or resistance. These levels are displayed on the chart as color-coded areas, typically with blue and red zones that visually highlight strong market barriers.
The eight lines include:
0/8 Level – Ultimate Resistance Zone
1/8 Level – Weak Resistance
2/8 Level – Reversal Level
3/8 Level – Top of Trading Range
4/8 Level – Major Support/Resistance (Key Level)
5/8 Level – Bottom of Trading Range
6/8 Level – Reversal Level
7/8 Level – Weak Support
8/8 Level – Ultimate Support Zone
The three most important Murrey Math levels are:
0/8 – Extreme Resistance
4/8 – Strongest Support/Resistance Line
8/8 – Extreme Support
These levels help traders identify market extremes, fair value zones, and likely turning points.
Murrey Math Lines BUY and SELL Signals
The indicator provides clear BUY and SELL opportunities based on how price interacts with the eight levels.
BUY Signals
A BUY signal may occur when:
Price touches the 8/8 level, showing extreme support
Price moves above 4/8, confirming bullish pressure
Price reverses upward from the 6/8 level
A breakout happens above 2/8, indicating a strong continuation
In the GBP/USD H4 example, BUY signals trigger when price bounces from strong support zones or breaks key Murrey levels confirming upward momentum.
SELL Signals
A SELL signal may occur when:
Price touches the 0/8 level, showing extreme resistance
Price breaks below 4/8, indicating bearish control
Price reverses downward from 2/8 or 6/8 levels
The market drops below 7/8, confirming weakness
Levels 2/8 and 6/8 are specifically known for signaling market reversals, making them high-probability zones for trade setups.
Understanding Level Strength
0/8 and 8/8 → Strongest reversal zones
1/8 and 7/8 → Weak zones, often temporary
2/8 and 6/8 → Potential reversal levels
4/8 → Central pivot zone (best entry/exit level)
When price crosses above 8/8 or below 0/8, it often indicates market uncertainty, meaning traders should avoid low-quality setups until price stabilizes.
Why Traders Use Murrey Math Lines
This indicator is especially useful for:
Spotting major support and resistance
Determining potential reversal zones
Timing entries and exits more accurately
Filtering trades according to Market Structure
Understanding the “fair value” zone of price
It performs well on all timeframes but is particularly effective on H1, H4, and Daily charts.
Tips for Best Results
For maximum accuracy, combine the Murrey Math Lines Indicator with:
Trendlines
Moving averages
Price Action patterns (pin bars, engulfing candles, breakouts)
Fibonacci levels
Volume indicators
Multiple confirmations increase signal strength and reduce false entries.
Conclusion
The Murrey Math Lines Indicator for MT4 is an excellent tool for identifying support, resistance, and reversal points using eight mathematically calculated levels. Its structure helps traders determine optimal entry and exit zones with confidence. You can download the indicator for free from IndicatorForest.com and start improving your market analysis today.
FAQ
4 Downloads
Published:
Nov 15, 2025 01:07 AM
Category: