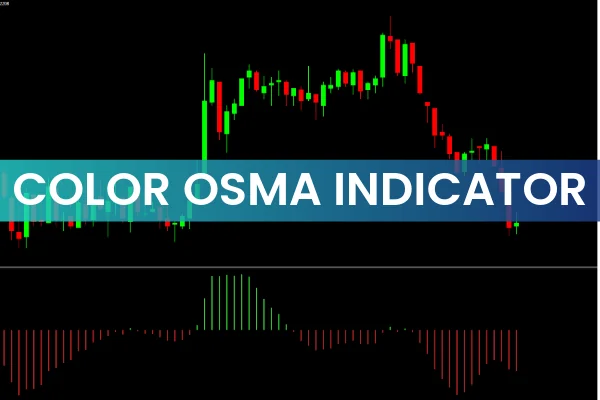
The Color OSMA Indicator is a simple and effective trading tool that uses colored histograms based on the oscillator of the moving average. It helps traders identify market trends, momentum shifts, and potential trade opportunities across any instrument or timeframe, including forex, stocks, and commodities.
How the Color OSMA Indicator Works
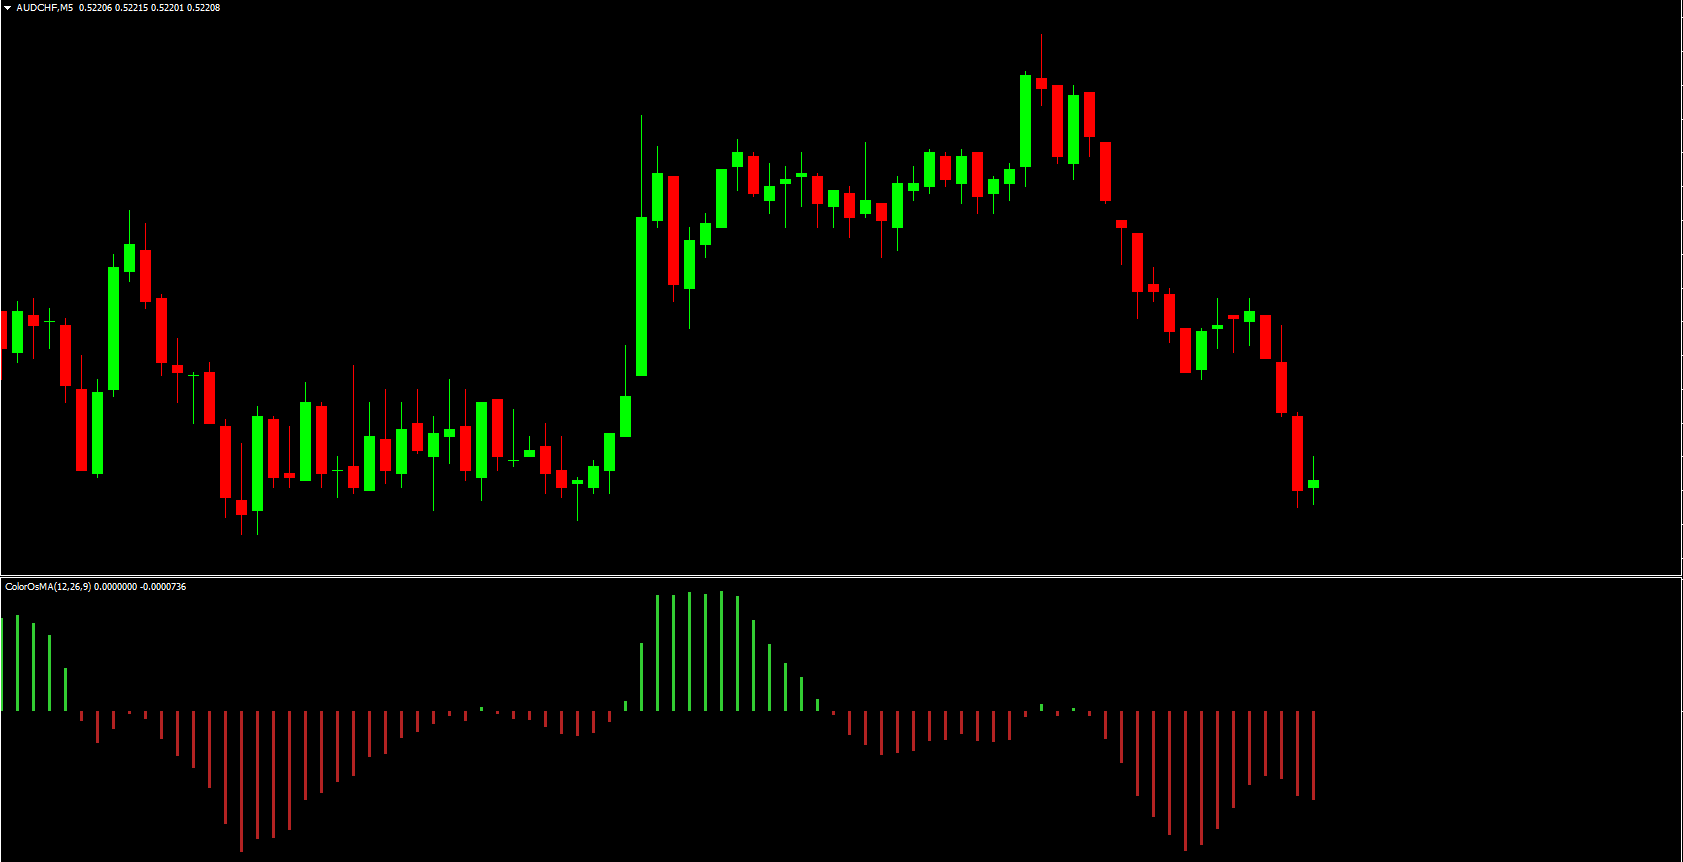
The indicator displays histograms in a separate window below the price chart, similar to the MACD. Trading signals are derived from bar position relative to the zero line and bar color:
Buy Signal: When green bars form above the zero line, it indicates bullish momentum. Longer bars signify stronger upward pressure, suggesting a potential buy opportunity.
Sell Signal: When brownish-red (firebrick) bars appear below the zero line, it signals bearish momentum. Longer bars indicate stronger downward pressure, suggesting a potential sell opportunity.
Trading With Color OSMA
Identify Buy Opportunities: Open a long position when green bars form above the centerline. Monitor bar length for momentum strength.
Identify Sell Opportunities: Open a short position when brownish bars appear below the centerline. Longer bars indicate strong bearish momentum.
Momentum Confirmation: Watch for histogram shortening, which signals momentum weakening and potential reversal or exit.
For example, on a EUR/USD weekly chart, green bars signal the start of an uptrend, while shortening green bars indicate weakening bullish pressure. Conversely, brownish bars appear when the downtrend picks up, providing an opportunity to ride the bearish movement.
Benefits of Using Color OSMA
Simple and Visual: Easy-to-read colored histograms indicate market direction.
Works on Any Timeframe: Compatible with intraday, daily, weekly, and monthly charts.
Momentum Analysis: Clearly identifies strengthening or weakening market trends.
Versatile Application: Suitable for forex, stocks, commodities, and other instruments.
Free to Download: Available from IndicatorForest.com.
Conclusion
The Color OSMA Indicator is an ideal tool for traders looking to identify market direction, momentum shifts, and potential trade setups. By analyzing the color and position of histogram bars, traders can make better-informed decisions and align their trades with prevailing market trends. Download the Color OSMA Indicator for free from IndicatorForest.com to improve your trading accuracy and momentum analysis.
FAQ
Published:
Nov 20, 2025 01:37 AM
Category: