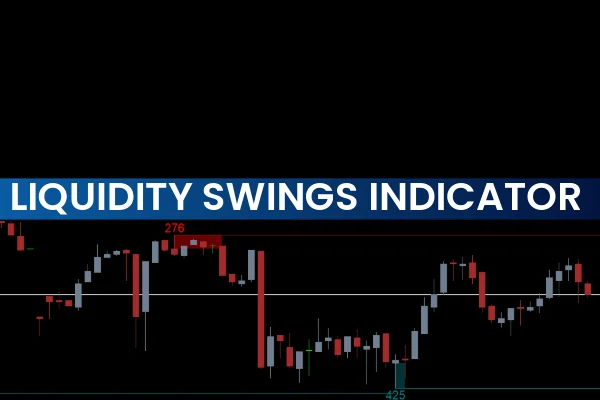
The Liquidity Swings Indicator MT4 is an advanced market-structure tool designed by LuxAlgo to help traders detect crucial swing highs and lows where liquidity accumulates. These liquidity pockets often serve as magnets for price, making them essential for identifying potential reversals, breakouts, and order-flow reactions.
By using wick extremities and swing-volume calculations, the indicator gives traders a clear visual map of where institutional interest may exist. This makes it ideal for traders who use price action, Supply And Demand zones, order-flow concepts, smart money techniques, or sniper-entry strategies.
Whether you trade forex, indices, commodities, or crypto, the Liquidity Swings Indicator provides a reliable framework for detecting market turning points with precision.
How the Liquidity Swings Indicator Works
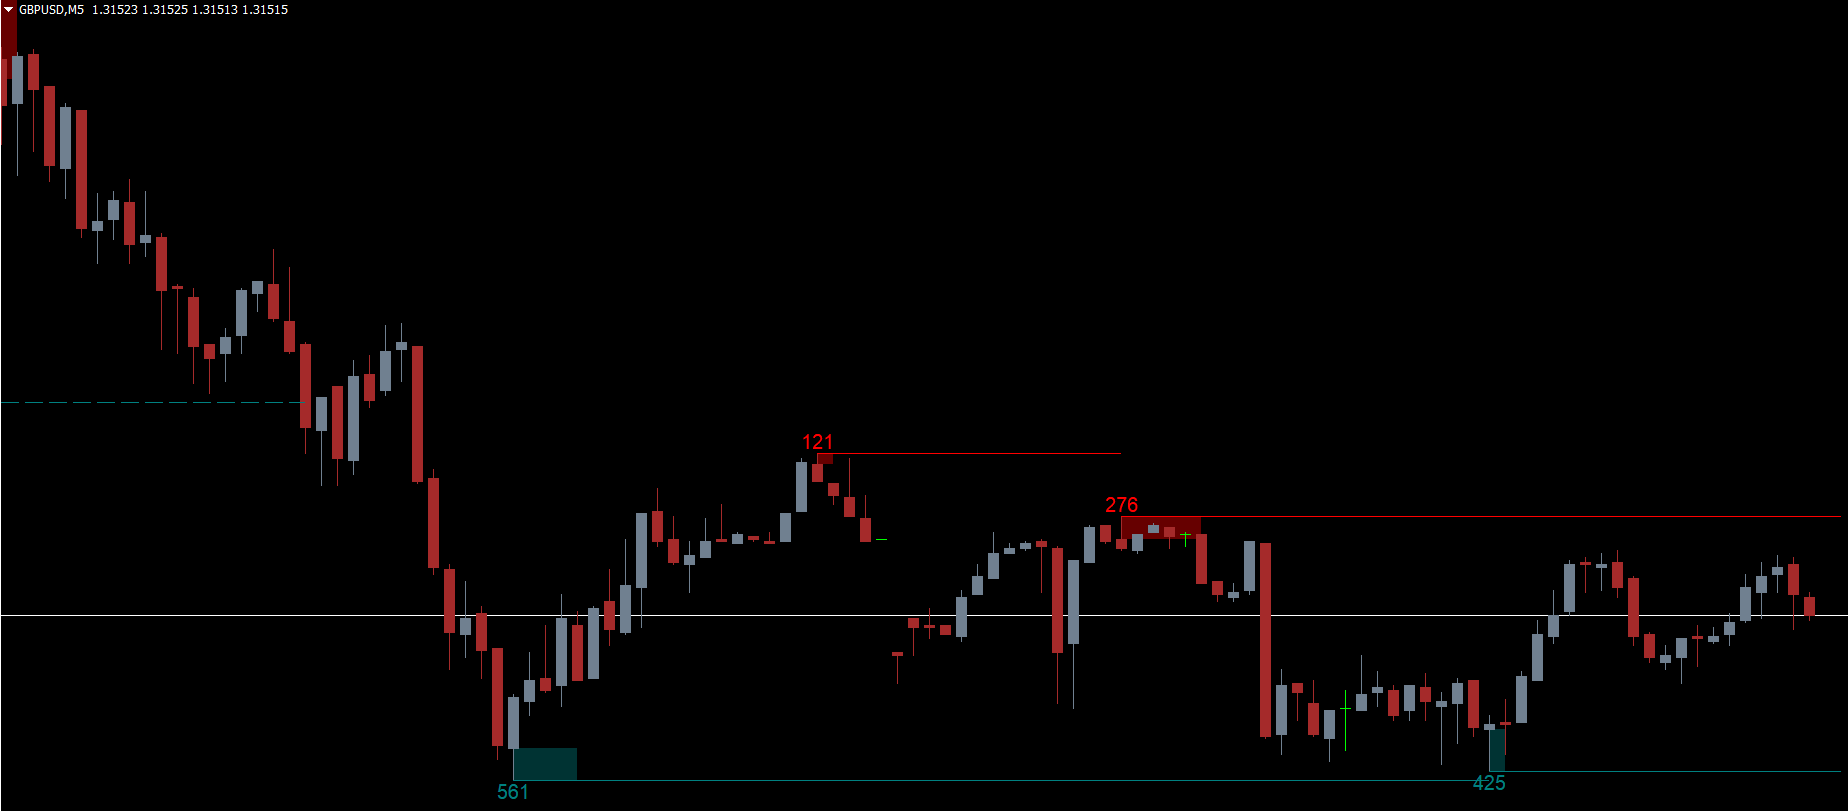
The indicator plots two main elements:
Red swing highs – areas where sell-side liquidity may sit
Teal swing lows – areas where buy-side liquidity is clustered
Each swing point includes a volume value that represents the strength and significance of that liquidity pool. The higher the value, the more likely institutions will target that level.
Key Benefits
Identifies major and minor liquidity zones
Shows where price may react sharply
Helps forecast reversals and continuation moves
Supports sniper-style entries
Works with any timeframe on MT4
Liquidity Swings Indicator Trading Signals
Rejection Signals
A rejection at a red swing high suggests bearish pressure. This may indicate:
Ideal short entries
Potential Trend Reversal
Institutional liquidity grabs
A bounce from a teal swing low signals possible bullishness:
Buy opportunities
Demand reactions
SMC-style displacement zones
Breakout Signals
When price breaks above a red swing high:
Liquidity is consumed
A continuation move is likely
Trade the retest for confirmation
When price breaks below a teal swing low:
Bearish momentum increases
The zone becomes resistance
If multiple swing levels appear close together, the area becomes a high-interest liquidity cluster, often leading to:
Strong reversals
Rapid continuation moves
Institutional-level manipulation or accumulation
These clusters are excellent for:
Mapping support/resistance
Identifying high-probability entry areas
Planning take-profit zones
How to Use It in Your Trading Strategy
Combine with Market Structure
Using the Liquidity Swings Indicator with basic structure helps you:
Identify trend direction
Confirm structural breaks
Validate liquidity grabs
Pair With Volume or Order-Flow Tools
For improved accuracy:
Add volume indicators
Use delta-style oscillators
Combine with supply/demand mapping
Use With Smart Money Concepts (SMC)
The indicator works especially well for:
Identifying inducements
Spotting liquidity sweeps
Confirming BOS/CHOCH signals
Marking premium/discount zones
Conclusion
The Liquidity Swings Indicator MT4 is a powerful liquidity-mapping tool that helps traders pinpoint where price may react due to institutional orders. By highlighting swing highs, swing lows, and significant liquidity clusters, it allows traders to anticipate market moves with accuracy and confidence.
Whether you trade reversals, breakouts, or smart-money setups, this tool enhances your technical analysis and provides a clearer view of market intentions.
👉 Download more premium MT4 and MT5 indicators at IndicatorForest.com and upgrade your trading strategy today.
FAQ
25 Downloads
Published:
Nov 17, 2025 21:54 PM
Category: