Master Trend Strength with the ADX Directional Movement Indicator
In the world of technical analysis, knowing the direction of the market is only half the battle. The real challenge is determining if that trend has enough strength to sustain a profitable move. The ADX Directional Movement Indicator is widely considered the ultimate tool for quantifying trend intensity, helping traders distinguish between a powerful trending market and a stagnant, range-bound environment.
What is the ADX Directional Movement Indicator?
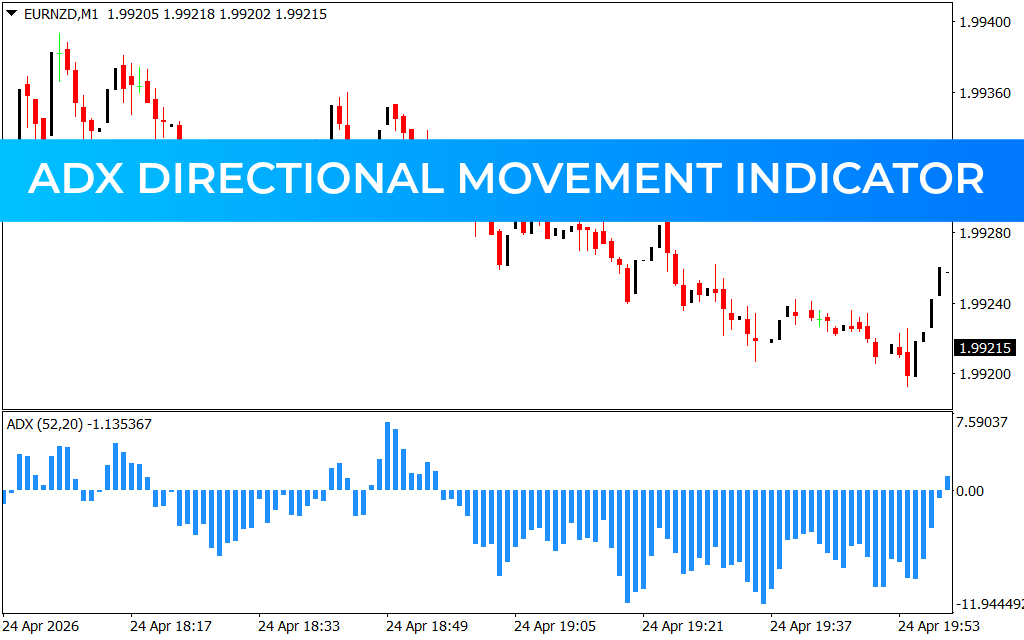
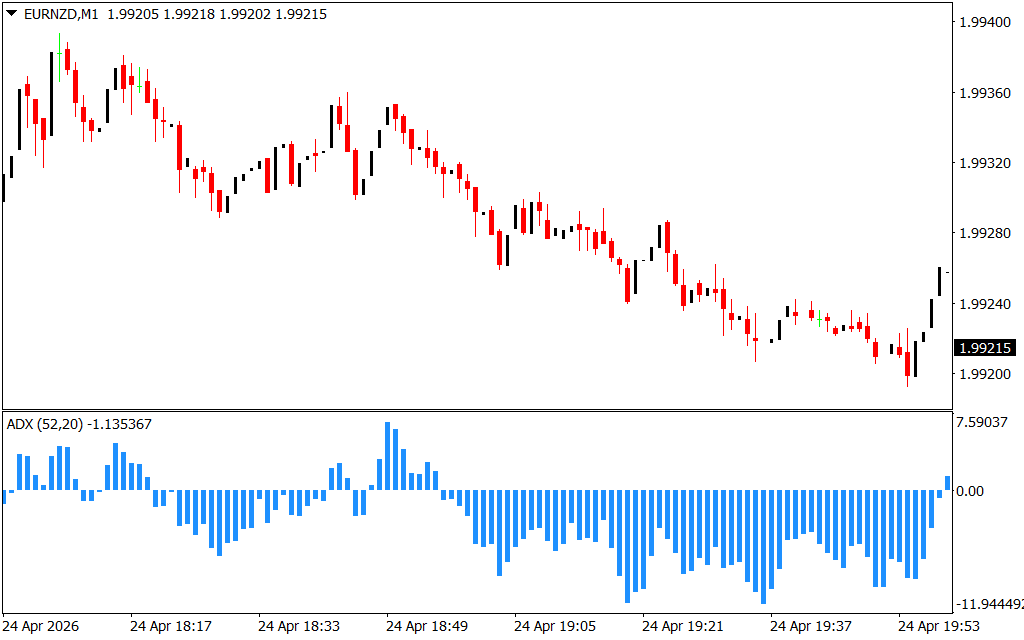
The Average Directional Index (ADX) is a core component of the Directional Movement System. While traditional ADX often appears as a single line, advanced versions—like the one shown in the EURNZD M1 chart—utilize a histogram format to provide a more intuitive visual of market momentum.
Unlike oscillators that indicate whether a market is overbought or oversold, the ADX is strictly a Trend Strength indicator. It measures the expansion of the price range over a set period. In the provided chart, the blue histogram bars extending above and below the zero line represent the velocity and dominance of a specific direction, allowing traders to see exactly when momentum is accelerating.
How to Interpret ADX Histogram Signals
The ADX Directional Movement Indicator provides a multi-layered view of Price Action:
- Trend Intensity: Large bars indicate a strong trend. When the histogram expands, it signals that the current move (whether bullish or bearish) is being backed by significant institutional conviction.
- Momentum Shifts: As bars begin to shrink toward the zero line, it indicates that the trend is losing steam. This "fading" momentum is often an early warning sign of a coming consolidation or a potential reversal.
- Directional Bias: By observing whether the weight of the histogram is primarily positive or negative, traders can align themselves with the path of least resistance. For instance, the sustained negative bars in the EURNZD example highlight a dominant bearish cycle.
Strategic Advantages for Modern Traders
One of the biggest mistakes traders make is using trend-following strategies in a flat market. The ADX Directional Movement Indicator acts as a high-level filter:
- Filter Choppy Markets: When ADX values are low (small histogram bars), the market is likely ranging. Professional traders use this signal to avoid being "chopped up" by false breakouts.
- Confirm Breakouts: A breakout from a support or resistance level is significantly more reliable if accompanied by a surge in the ADX histogram.
- Exit Strategy: Instead of guessing where the top or bottom is, traders can use the indicator to exit when trend strength officially begins to collapse, maximizing the profit captured from a single move.
Conclusion
Whether you are a scalper looking for quick bursts of momentum or a swing trader following long-term cycles, the ADX Directional Movement Indicator is an essential addition to your MetaTrader toolkit. It takes the guesswork out of trend analysis, providing a mathematical foundation for your trading decisions and ensuring you only enter the market when the odds of a sustained move are in your favor.
1 Download
Last Update:
Apr 25, 2026 22:41 PM
Published:
Feb 02, 2026 13:33 PM
Category: